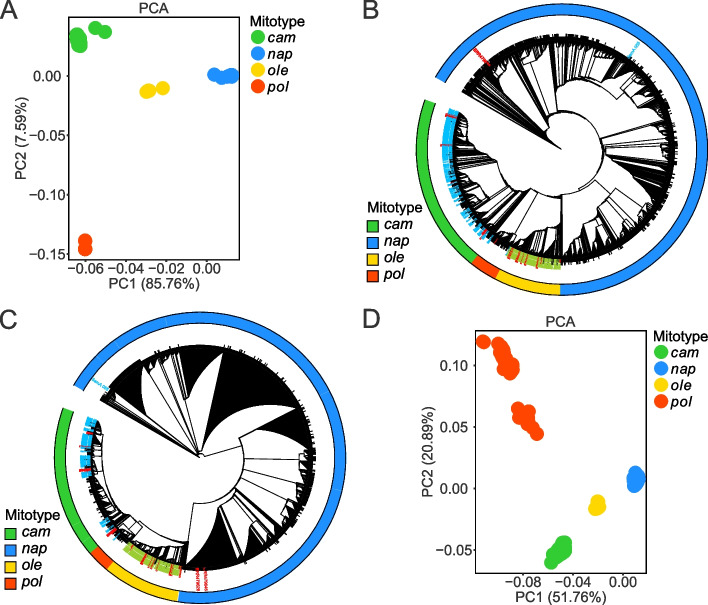
Fig. 4.
Population structure of B. napus accessions and its two progenitor species. A PCA plot of assembled cp genomes. B Chloroplast phylogeny of assembled B. napus combined together with 199 B. rape, 119 B. oleoracea and 31 synthetic B. napus accessions. C Mitochondria phylogeny of B. napus and its two progenitor species. D PCA plot of assembled mt genomes. ML phylogenetic tree were constructed using SNPs after filtering loci with minor allele frequencies (MAFs) < 0.005 and missing calls > 20%. In PCA plots, samples of different cytoplasmic types were highlighted as dots in different colors. In phylogenetic tree, the cytoplasmic type of each sample was annotated at outer circle as a vetical bar highlighted in different colors. Labels for each sample in phylogenetic tree were also highlighted with four other colors corresponding to groups as follows: black, natural B. napus; red, synthetic B. napus; yellowgreen, B. olracea; cyan, B. rapa

