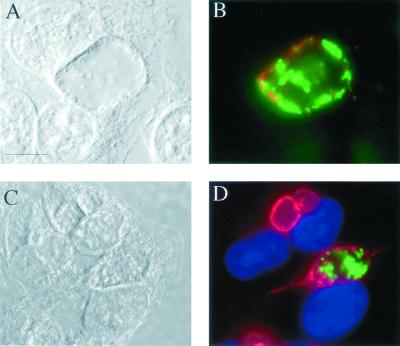
FIG. 7.
C. trachomatis L2 and C. suis R19 growth within a single inclusion. HeLa cells sequentially infected with R19 (time, 0 h) and L2 (time, 16 h) were fixed with methanol and labeled with antibodies directed against L2 and R19. (A) DIC micrograph of an infected cell containing a single inclusion 50 h after infection with R19. (B) Fluorescent image of the cells shown in panel A labeled with antisera against L2 MOMP (red) and R19 MOMP (green). (C) DIC micrograph of infected cells fixed 32 h after infection with R19. (D) Fluorescent image of the cells shown in panel C labeled with antisera against L2 IncA (red) and R19 MOMP (green). The nuclei of cells shown in panel D are colored blue with 4′,6-diamino-2-phenylindole (Sigma). Bar, 5 μm.

