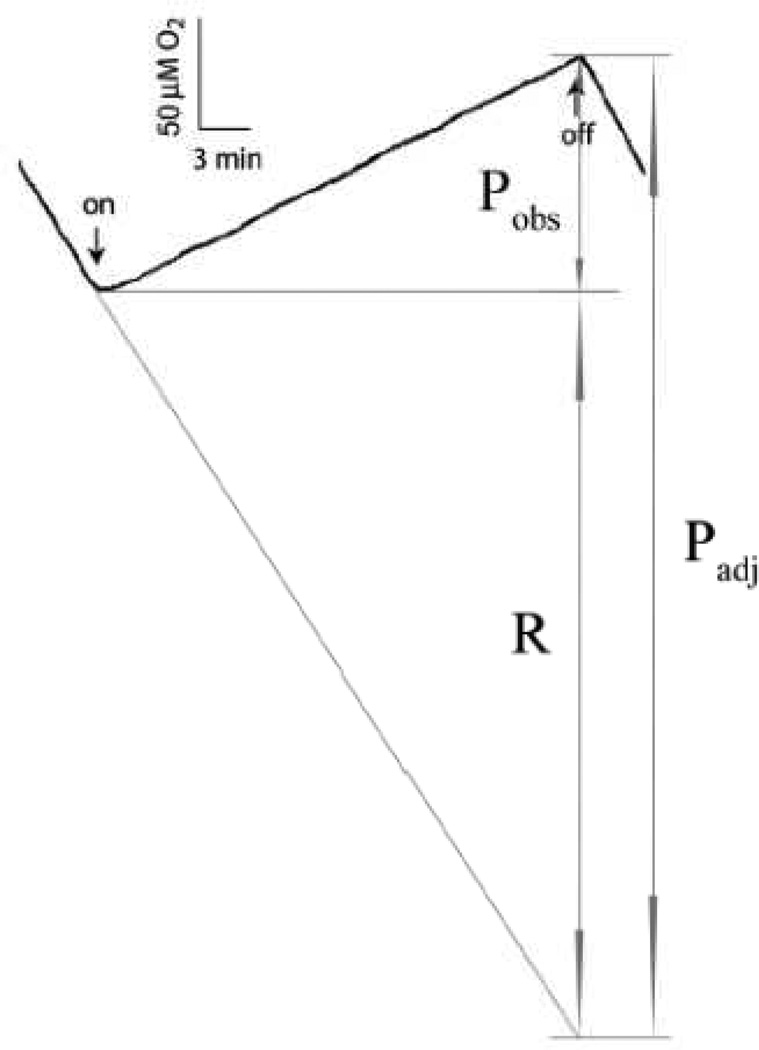
Figure 2. A typical chart recorder trace of the light-induced O2 evolution of the ΔPSI (ΔAB) cells in the presence of 5 mM glucose and 10 mM NaHCO3.
The rates of the dark respiration (R) and of the light-induced O2 evolution either with (Padj) or without (Pobs) adjustment for dark respiration are labeled. The down- and up-arrows indicate the times when the actinic light was turned on and off, respectively. This figure shows that the ΔAB cells were able to maintain substantial and constant rates of net light-induced O2 evolution Pobs for 30 min. The Chl concentration of this sample was 1.3 µM. The experiment was carried out at 30°C.

