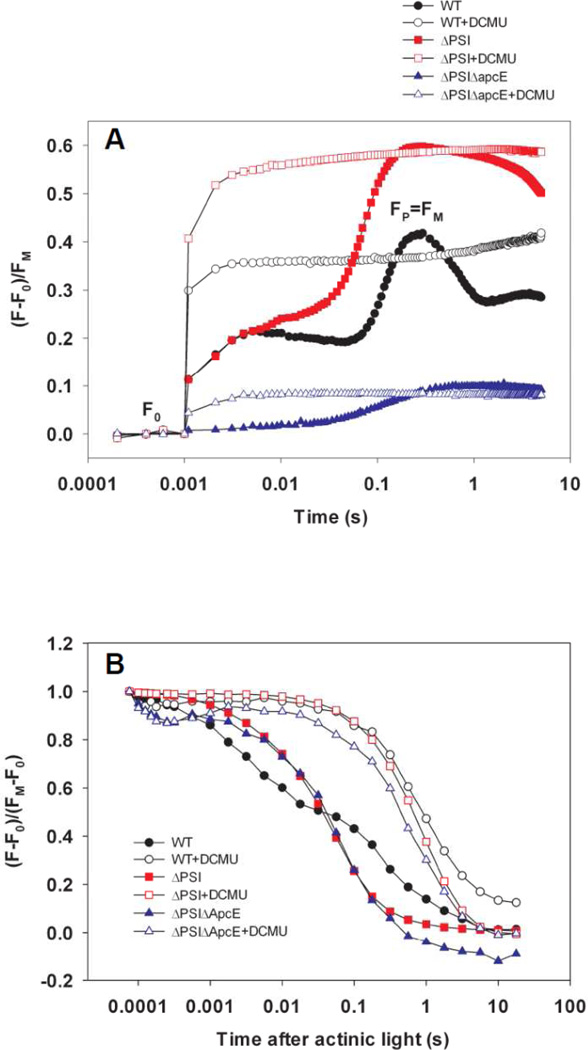
Figure 4. DCMU effects on Chl a fluorescence kinetics of the WT and the ΔPSI cells.
(A) Chl a fluorescence induction curves of the WT (circles), ΔAB (squares, labeled as ΔPSI) and ΔPSIΔApcE (triangles) cells show the same effect of DCMU on the WT and ΔPSI cells: The illumination time needed to fully reduce QA decreased from hundreds of milliseconds (WT: 170 ms; ΔAB: 320 ms; ΔPSIΔApcE: 560 ms) in the absence of DCMU to 2 milliseconds or less when DCMU is present. (B) Chl a fluorescence dark relaxation curves of the WT (circles), ΔAB (squares, labeled as ΔPSI) and ΔPSIΔApcE (triangles) cells show the same slow kinetics in both the WT and ΔPSI cells in the presence of DCMU (open symbols, TDCMU ≈ 1 s) and yet there is drastically different kinetics between the WT (black closed circles, bi-phasic, TslowWT = 0.1–1 s and TfastWT ≈ 1–10 ms) and ΔPSI (red closed squares for ΔAB and blue closed triangles for ΔPSIΔApcE, monophasic, T ΔPSI ≈ 10–100 ms) cells in the absence of DCMU. In both (A) and (B), a total of 370 saturating actinic flashes were given at the frequency of 1 kHz to maximally reduce QA and the PQ pool prior to recording the dark relaxation kinetics. The time when the actinic flashes were turned off was set as zero. DCMU was applied at a final concentration of 10 µM.

