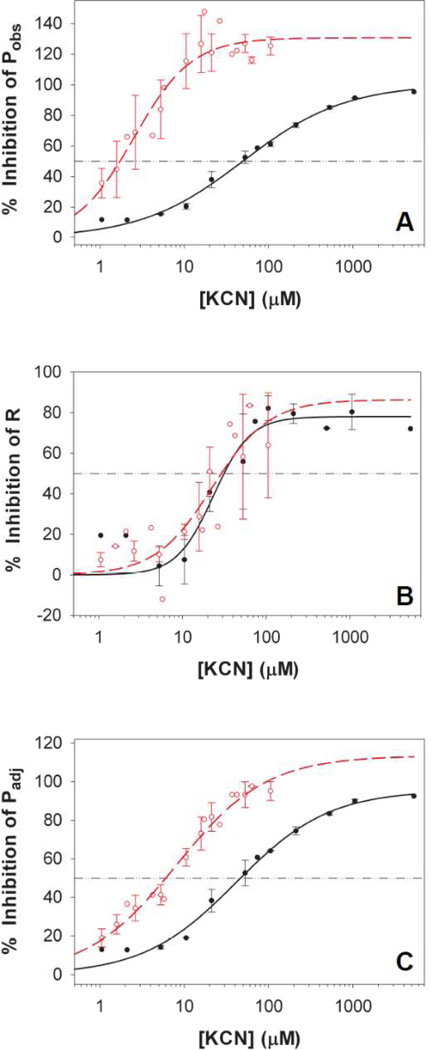
Figure 6. KCN titration of (A) Pobs, (B) R and (C) Padj of the WT and the ΔPSI cells.
Pobs and Padj of the ΔPSI cells were much more sensitive to KCN than those of the WT cells, whereas R of the ΔPSI cells had the same sensitivity to KCN as that of the WT cells. The I50 values for KCN inhibition were 49 µM for Pobs of the WT cells (Panel A, black closed circles), 1.7 µM for Pobs of the ΔPSI cells (Panel A, red open circles), 46 µM for Padj of the WT cells (Panel C, black closed circles), 6 µM for Padj of the ΔPSI cells (Panel C, red open circles) and 30 µM for R of both the WT (Panel B, black closed circles) and ΔPSI (Panel B, red open circles) cells. Pobs, R and Padj of both the WT and the ΔPSI cells were measured in BG-11 medium in the presence of 5 mM glucose and 10 mM NaHCO3. The titration curves of the WT cells (black closed circles) are plotted from 2 data sets. The titration curves of the ΔPSI cells (red open circles, for ΔAB, ΔVIII–XI, and ΔPSI/WV strains) are plotted from 5 data sets. Standard errors are indicated. In addition, the KCN sensitivities of both the WT and ΔPSI cells were not affected by the supplemental Cu2+ in the growth medium, as the data shown are for cells grown both with and without Cu2+ supplement. For each rate, 100% inhibition by KCN means the rate is reduced from the control value (with no KCN) to zero. An inhibition that is greater than 100% in the case of Pobs means that in the presence of KCN, the cells showed net O2 consumption instead of displaying net O2 evolution.

