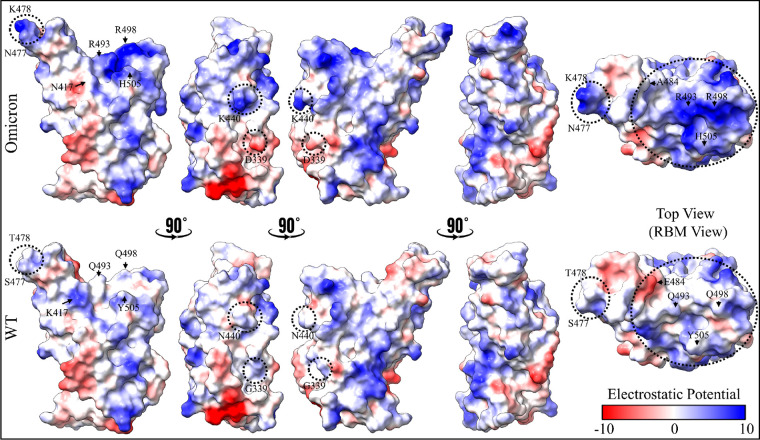
Figure 4.
Comparison of electrostatic potential surface of RBD in mutated Omicron (top) and WT (bottom). From left to right, the first four shapes are of the RBD front view, rotated sequentially by 90°, while the fifth one represents the RBD top view. Important residues that changed their electrostatic potential surfaces are labeled. Negative-potential residues are shown in red, near-neutral residues in white, and positive-potential residues in blue.

