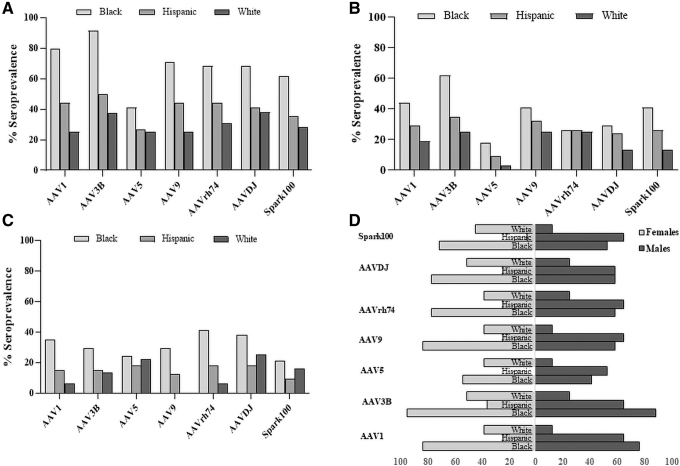
Figure 2.
AAV seroprevalence and titer distribution among different races. (A) AAV seroprevalence among different races. Data are shown as seropositivity among all donors who self-identified as black, Hispanic, or white. (B) Distribution of donors with high-titer NAbs (>40) by race. (C) Distribution of donors with low-titer NAbs (5 to ≥20) by race. (D) Gender distribution of seropositive donors by race. Data are plotted as seropositive males (dark bars) or females (white bars) within each race. Numbers on the bottom indicate percent seroprevalence.

