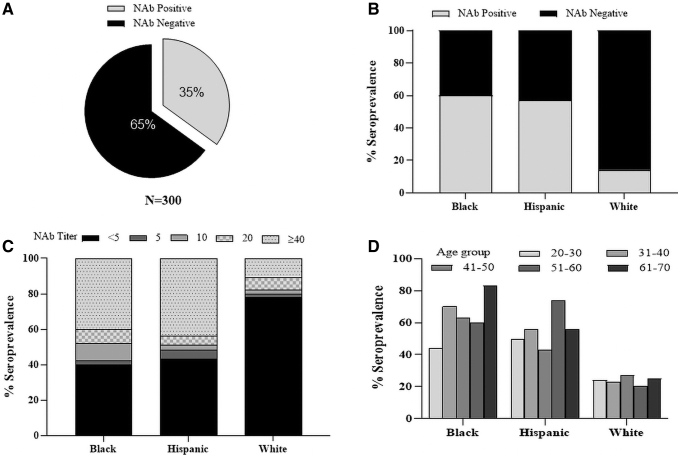
Figure 3.
AAV1 seroprevalence in a second cohort of 300 donors. (A) Demographically adjusted AAV1 seroprevalence. (B) Seropositivity among all donors who self-identified as black, Hispanic, or white. (C) Seropositive donors were stratified based on NAb titer with each race. (D) Donors were binned by age before calculating seropositivity by race.

