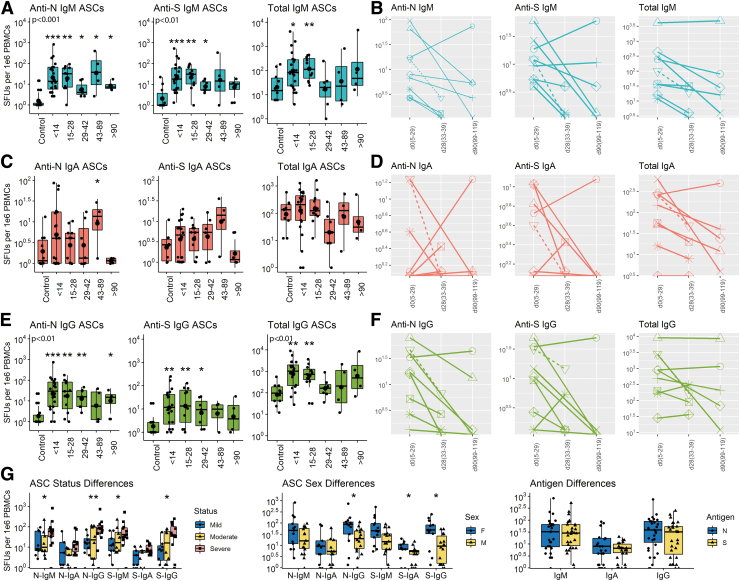
FIG. 4.
Cross-sectional and longitudinal ELISpot analyses of total and virus-specific IgM, IgA, and IgG ASCs in circulation. PBMCs were cultured on plates coated with lysates from cells expressing the N protein, the S protein or antibody to immunoglobulin, stained with antibody to IgM, IgA or IgG and spots counted. Data are expressed as SFUs/106 PBMCs. Samples are grouped based on time since symptom onset. (A) anti-N, anti-S, total IgM; (B) longitudinal anti-N, anti-S, total IgM; (C) anti-N, anti-S, total IgA; (D) longitudinal anti-N, anti-S, total IgA; (E) anti-N, anti-S, total IgG; (F) longitudinal anti-N, anti-S, total IgG. Boxplots are colored based on isotype: IgM (aqua), IgA (red), IgG (green). Sex and clinical disease status are indicated in longitudinal plots: male (circles), female (triangles); mild/moderate (solid line), severe (dashed line). (G) Comparisons of N- and S-specific SFUs based on severity of disease (left), sex (middle) and antigen specificity (right). All data were log transformed and significance is shown if detected at p < 0.05 compared to control by a Wilcoxon test for pairwise and Kruskal–Wallis test for global comparisons: *p < 0.05, **p < 0.01, ***p < 0.001. ASCs, antibody-secreting cells; ELISpot, enzyme-linked immunospot; SFUs, spot-forming units. Color images are available online.

