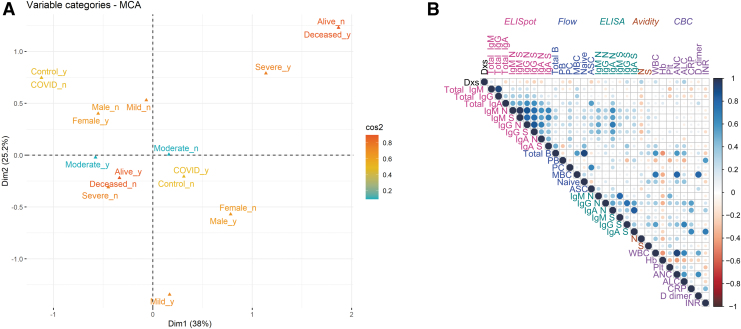
FIG. 7.
MCA and correlation matrix. (A) MCA showing clustering of all individuals based on disease severity, survival, infection status, and sex. Colored by contribution where red is high and blue is low based on squared cosine (cos2). (B) Correlation matrix representing experimental features that cluster above the level of 0.01 significance (Pearson correlation coefficients). Negative correlations are in red and positive correlations are in blue. Assays are color-coded and grouped from left to right/top to bottom as follows: ELISpot (pink), flow cytometry (blue), ELISA (green), avidity, and CBC (purple). CBC, complete blood count; ELISA, enzyme-linked immunosorbent assay; MCA, multiple correspondence analysis. Color images are available online.

