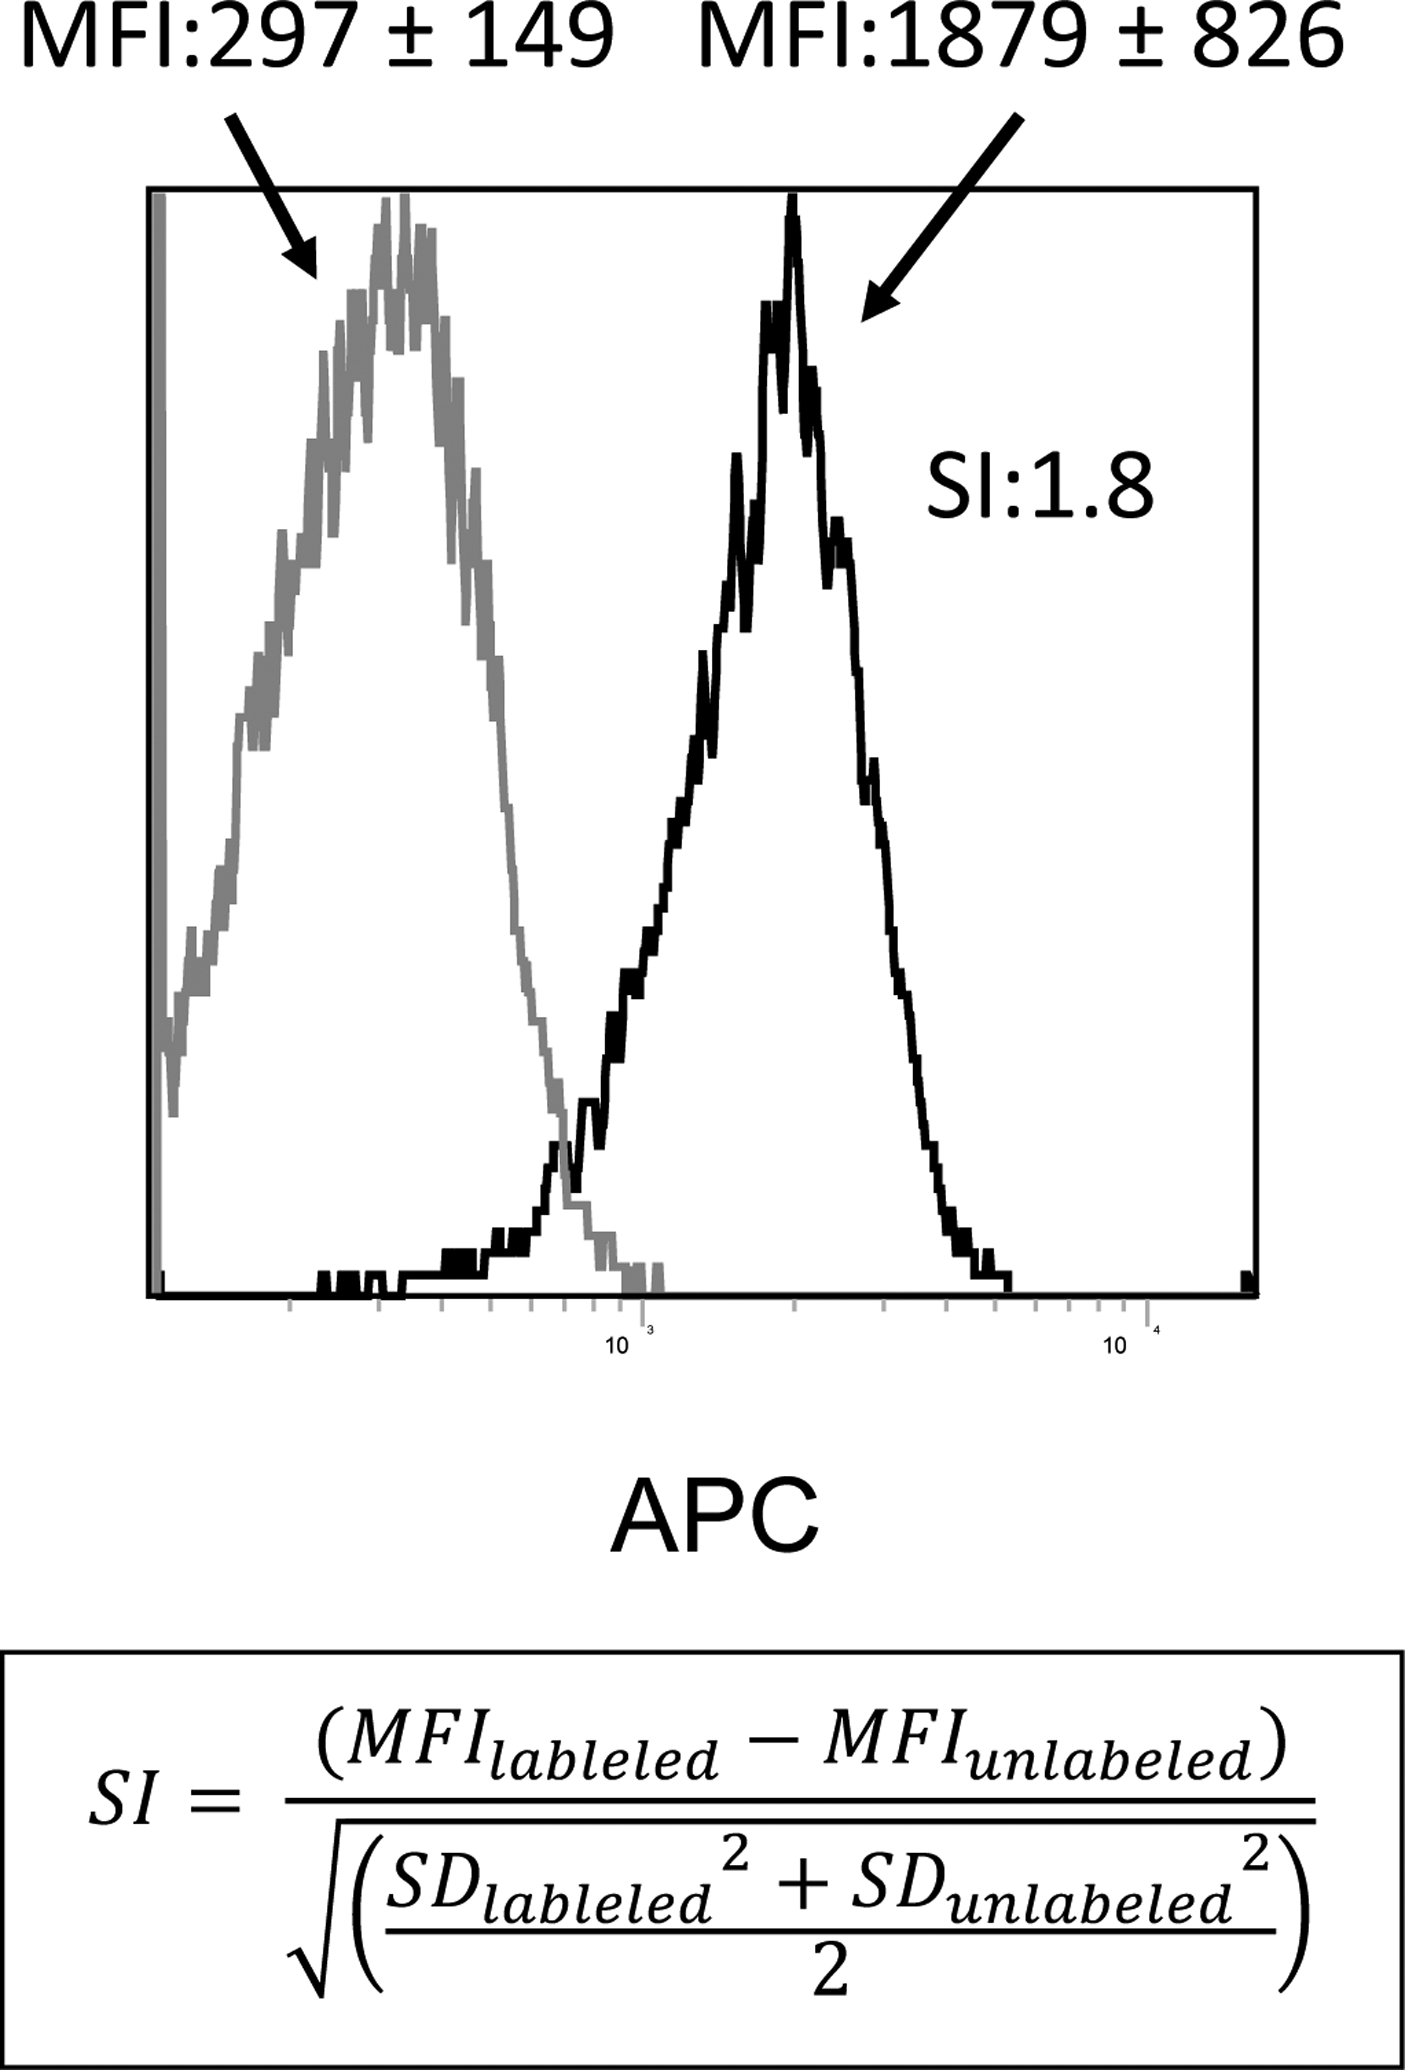
Figure 3. Establishment of the separation index (SI).

An example of flow cytometric stain of exosomes on beads gated on the main bead population visible on the forward/side scatter. Note, the low MFI of the isotype control compared to the MFI of the APC-labeled detection Ab (anti-OX40L Ab). Capture was with biotinylated anti-CD63 Ab. The SI calculated for this sample (1.8) is based on the difference in MFI between isotype control and Ab-stained exosomes on beads and the average spread of their distributions. The formula for calculating the SI is shown.
