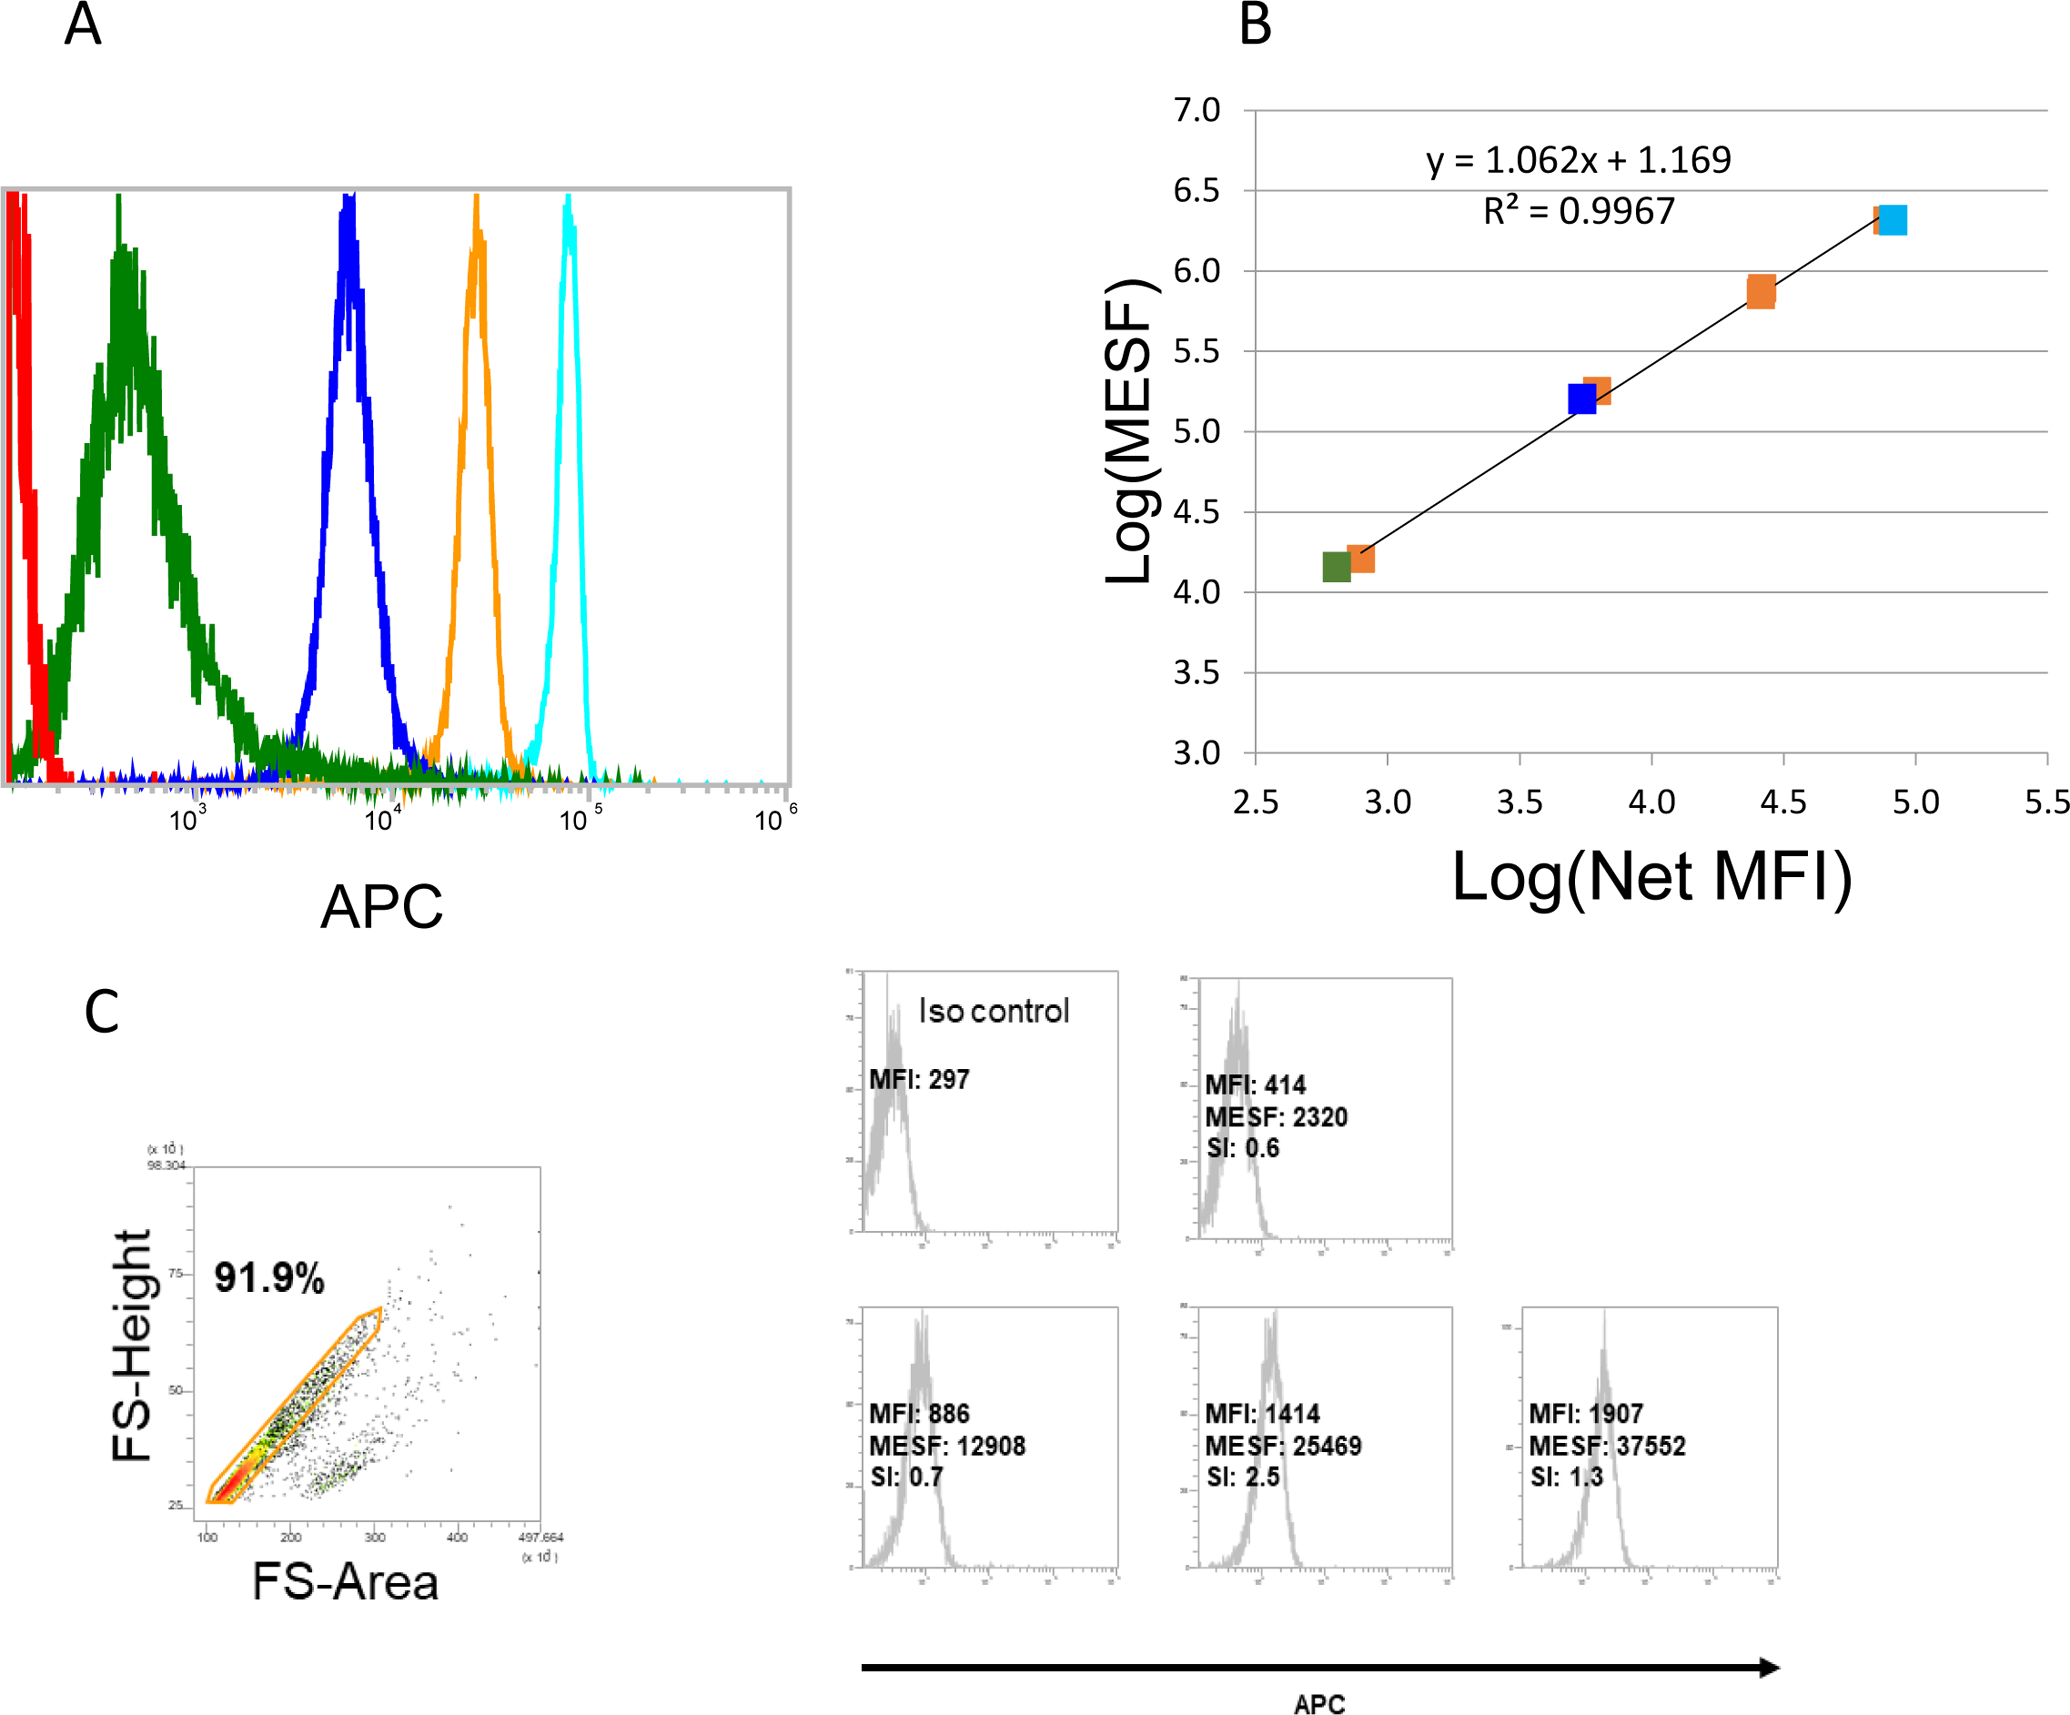
Figure 4. Flow cytometry of the MESF beads gated on the main bead population.

Quantum APC MESF microspheres (MESF) provided by Bangs Laboratories (bead lot 13028) were used to quantify the number of fluorescent molecules per bead. A: One blank population (Sample 0) and a series of four fluorescent microsphere populations of known MESF (samples 1–4). B: Linear curve constructed out of the MFI values from A. For the presented experiment, a standard curve relating MFI to known MESF of the microspheres was constructed as follows: 1) The published MESF of the APC calibration microspheres were log10 transformed; 2) The MFI of the blank microsphere was subtracted from the MFI of each APC-conjugated microsphere to yield Net MFI; 3) Next, MFI values were log10 transformed; 4) Log10(MESF) were regressed against the log10(Net MFI), providing a standard curve with slope and intercept coefficients. The MFI of the isotype control was subtracted from the MFI of each labeled exosome prep (stained at saturation) and the log10MESF was interpolated using the regression coefficients from step 4. The MESF was determined for each APC labeled exosome prep by taking the antilog10 of each interpolated log10(MESF) value. C: Data for expression of OX40L on CD63+ exosomes isolated from plasma of 4 patients with HNC. Biotinylated anti-CD63 Ab was used for exosome capture. The MFI value was determined for each exosome sample and was converted to MESF units. Note a broad range of MESF units among the exosomes of these patients, allowing for comparative quantitation of OX40L expression for each sample. These data were placed in the Flowdepository.org, file # FR-FCM-Z2XH.
