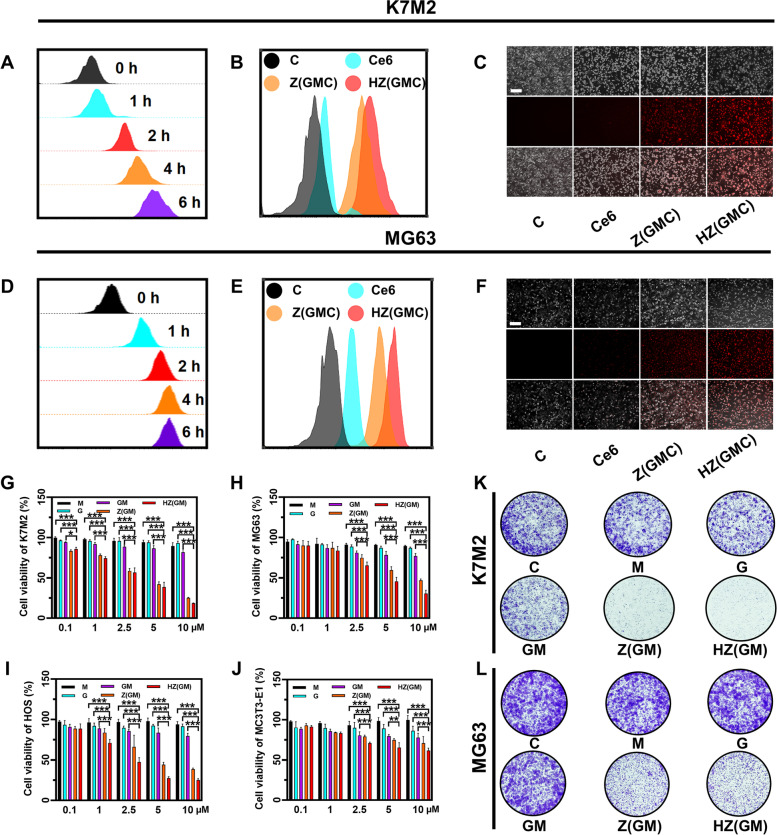
Fig. 2.
A Flow cytometric results of the cellular uptake capacity of HA/ZIF-8@Gem/D-1-MT NPs into K7M2 cells after the incubation at different time periods. Cellular uptake of different formulations into K7M2 cells after incubation for 4 h by flow cytometry (B) and inverted fluorescence microscope (C) (Scale bar = 200 μm). D Flow cytometric results of the cellular uptake capacity of HA/ZIF-8@Gem/D-1-MT NPs into MG63 cells after the incubation at different time periods. Cellular uptake of different formulations into MG63 cells after incubation for 4 h by flow cytometry E and inverted fluorescence microscope (F) (Scale bar = 200 μm). MTT assay to detect the cytotoxicity of K7M2 (G), MG63 (H), HOS (I), and MC3T3-E1 (J) incubated with HA/ZIF-8@Gem/D-1-MT NPs or others. Clone formation assay of K7M2 (K) and MG63 (L) incubated with HA/ZIF-8@Gem/D-1-MT NPs or others. Control, C; ZIF-8@Gem/D-1-MT/Ce6 NPs, Z(GMC); HA/ZIF-8@Gem/D-1-MT/Ce6 NPs; HZ(GMC). (n = 4, * P < 0.05, ** P < 0.01, and *** P < 0.001)

