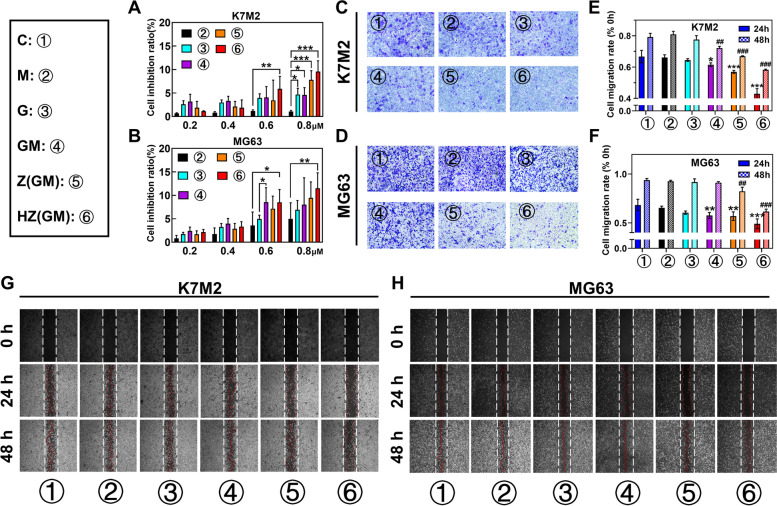
Fig. 4.
Cytotoxicity of different samples on K7M2 (A) and MG63 (B) cells. Evaluation of cell invasion of different formulations in K7M2 (C) and MG63 (D) cells for 24 h. Quantification of migration in K7M2 (E) and MG63 (F) cells. Evaluation of cell migration ability of different formulations in K7M2 (G) and MG63 (H) cells for 24 h and 48 h. (n = 3, * P < 0.05, ** P < 0.01, and *** P < 0.001 vs. control 24 h; # P < 0.05, ## P < 0.01, and ### P < 0.001 vs. control 48 h). Control, C; D-1-MT, M; Gem, G; ZIF-8, Z; ZIF-8@Gem/D-1-MT NPs, Z(GM); HA/ZIF, HZ; HA/ZIF-8@Gem/D-1-MT NPs, HZ(GM)

