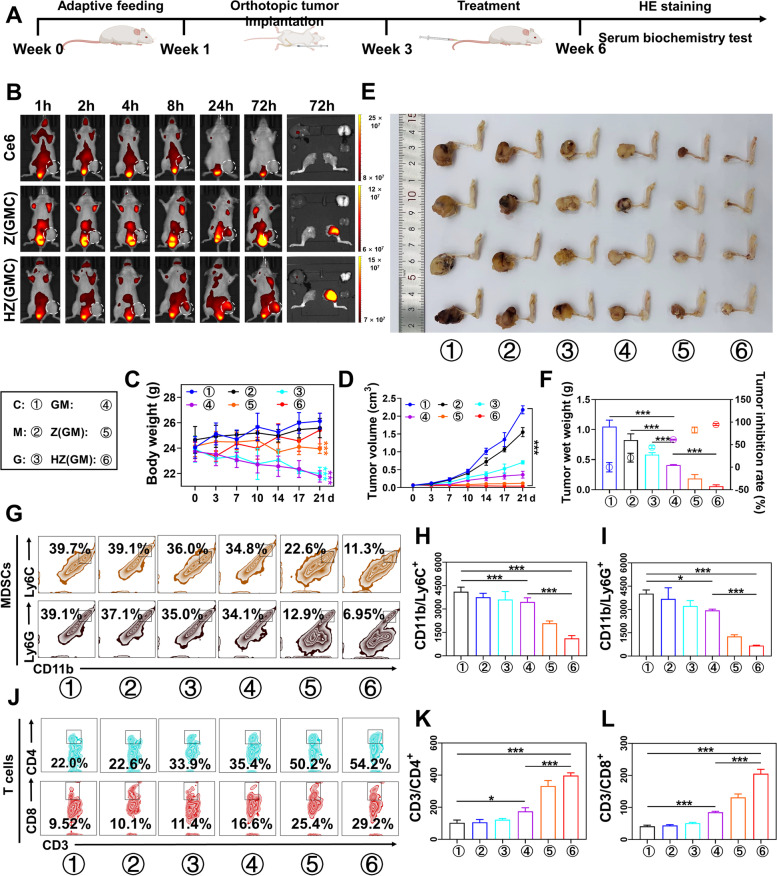
Fig. 6.
A Schematic illustration of the animal experimental model. B Bioluminescence images of tumor-bearing BALB/c mice at different time points after intravenous injection with Ce6, ZIF-8@Gem/D-1-MT/Ce6 NPs, and HA/ZIF-8@Gem/D-1-MT/Ce6 NPs. The body weight (C) and tumor volumes (D) of K7M2 OS-bearing mice with different treatments. (n = 4, *** P < 0.001). E OS tissues were obtained with BALB/c mice on day 21 after receiving different treatments. F Weights of isolated tumors and tumor inhibition ratio of K7M2 OS-bearing mice in different groups (n = 4, *** P < 0.001). G-I The percentage of M-MDSCs and G-MDSCs in tumor tissue (n = 3, *P < 0.05 and *** P < 0.001). J-L The percentage of Th cells and CTLs in tumor tissue (n = 3, *P < 0.05 and *** P < 0.001). Control, C; D-1-MT, M; Gem, G; ZIF-8@Gem/D-1-MT NPs, Z(GM); HA/ZIF-8@Gem/D-1-MT NPs, HZ(GM). ZIF-8@Gem/D-1-MT/Ce6 NPs, Z(GMC); HA/ZIF-8@Gem/D-1-MT/Ce6 NPs: HZ(GMC)

