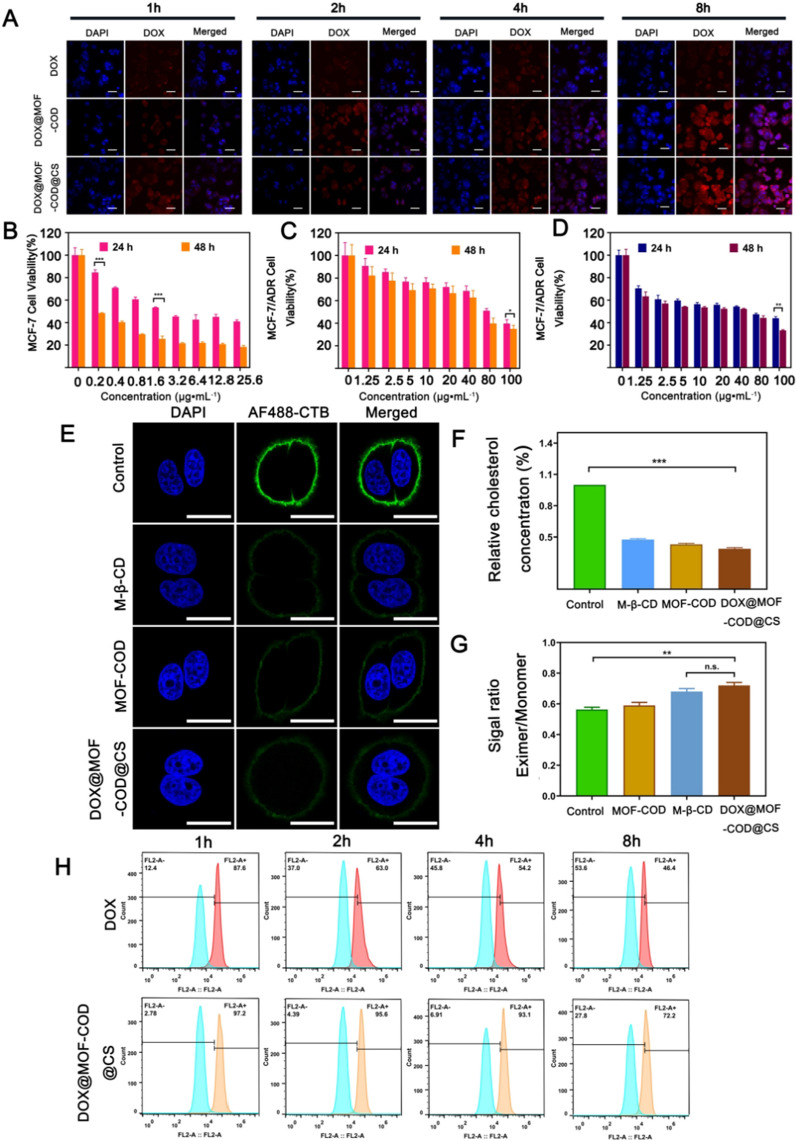
Fig. 2.
A DOX, DOX@MOF-COD, DOX@MOF-COD@CS nanoparticles co-incubated with MCF-7/ADR cells, the CLSM images of the drugs in the cells, scale bar: 50 μm. B and C Cell viabilities of MCF-7 and MCF-7/ADR cells incubated with DOX for 24 and 48 h (n = 6). D Cell survival rate of DOX@MOF-COD@CS nanoparticles incubated with MCF-7/ADR cells for 24 h and 48 h, respectively (n = 6). E CLSM observed membrane lipid rafts labeled with AF488-CTB, nucleus: DAPI blue fluorescent lipid rafts: green fluorescence labeled with AF-488-CTB, scale: 20 μm. F Determination of cholesterol content in MCF-7/ADR cells treated with Control, MOF-COD, M-β-CD and DOX@MOF-COD@CS groups. G Quantitative analysis of cell membrane fluidity (n = 3). H Flow cytometry analysis of DOX accumulation in MCF-7/ADR cells (n = 3). FL2-A: the fluorescence channel of DOX; FL2-A +: DOX fluorescence intensity increases; FL2-A−: DOX fluorescence intensity decreases. Data are presented as mean ± SD, *P < 0.05, **P < 0.01, ***P < 0.001

