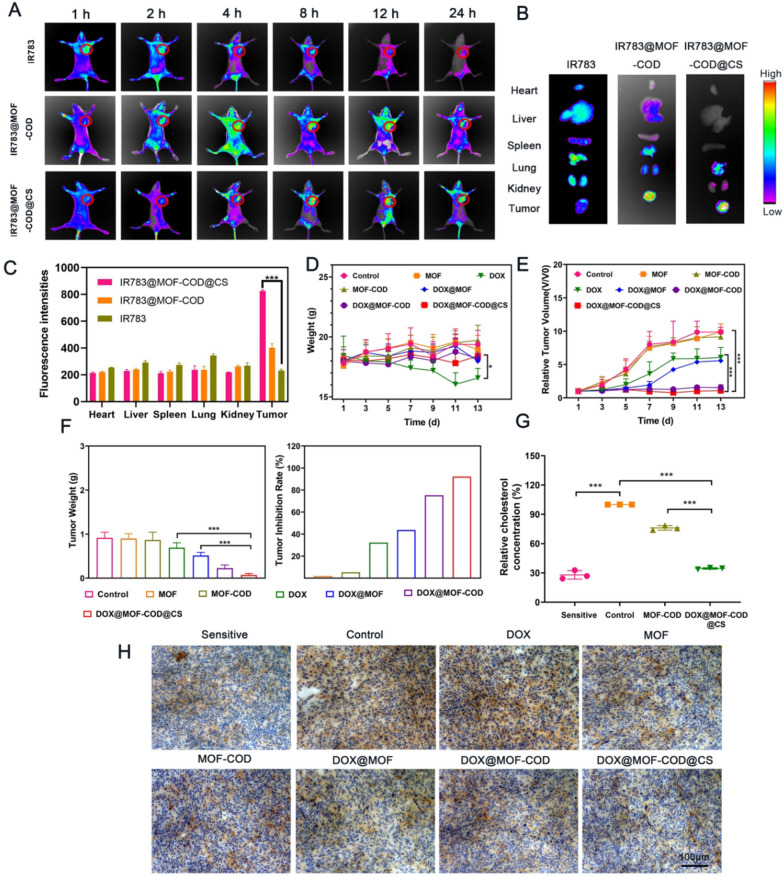
Fig. 4.
Distribution of IR783@MOF-COD@CS nanoparticles in tumor-bearing nude mice. A In vivo near-infrared fluorescence imaging of tumor-bearing nude mice labeled with IR783 and IR783@MOF-COD@CS through the tail vein at 1, 2, 4, 8, 12, 24, and 36 h, respectively (n = 3). B The results of fluorescence of the removed organs after 12 h of injection (n = 3). C The fluorescence intensity of IR783, IR783@MOF-COD and IR783@MOF-COD@CS in major organs. D The body weight change curves of different groups during treatment (n = 6). E Relative tumor volume change curve of each group (n = 6). F Tumor weight and inhibition rate of nude mice in each group. Data are presented as mean ± SD, *P < 0.05, **P < 0.01, ***P < 0.001. G Analysis of relative cholesterol content in tumor-bearing nude mice (sensitive group, MCF-7) and (drug-resistant group, MCF-7/ADR) (n = 3), **P < 0.01, ***P < 0.001. H After 14 days of treatment, the expression of P-gp in the parent tumor tissues (sensitive group, MCF-7) (drug-resistant group, MCF-7/ADR) was detected by immunohistochemistry

