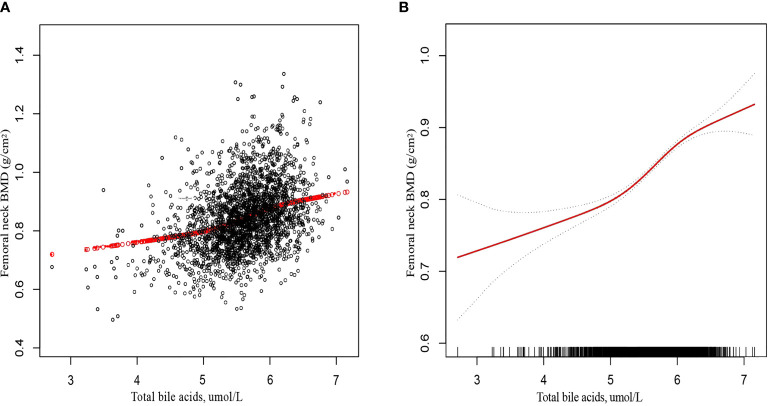
Figure 2.
The association between total bile acids and femoral neck bone mineral density. (A) Each black point represents a sample. (B) The solid red line represents the smooth curve fit between variables. Gray bands represent the 95% confidence interval from the fit. Age, sex, education, obesity, smoking status, CKD, diabetes, hypertension, drinking status, TBil, AST, ALP, GGT, ALT, TC, TG, HDL-C, and LDL-C were adjusted.

