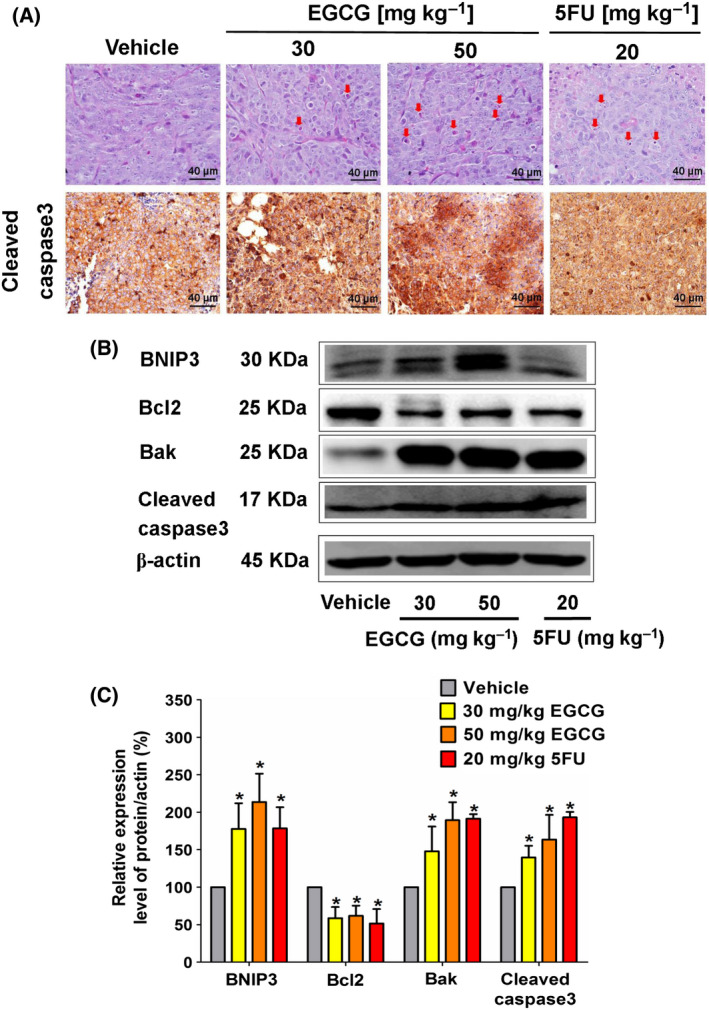
Fig. 4.

The effect of EGCG on the morphology of the apoptotic characteristics and the expression of proapoptotic proteins in HCT116 tumor xenografts of nude mice. (A) Representative image of tumor hemotoxylin and eosin staining presents the morphology of apoptosis (arrow marks) and immunohistochemistry (scale bar = 40 μm) depicts the intensity of cleaved caspase‐3 expression in tumor tissues following the indicated dose of EGCG treatment. (B) A representative immunoblotting assay shows anti‐apoptotic and proapoptotic protein expression in tumor tissue and (C) a histogram depicts the quantitative protein expression/β‐actin level. Representative data from five tumors in each group were collected and presented as the mean ± SD. *P < 0.05 compared to the control using one‐way ANOVA with Tukey’s post‐hoc analysis.
