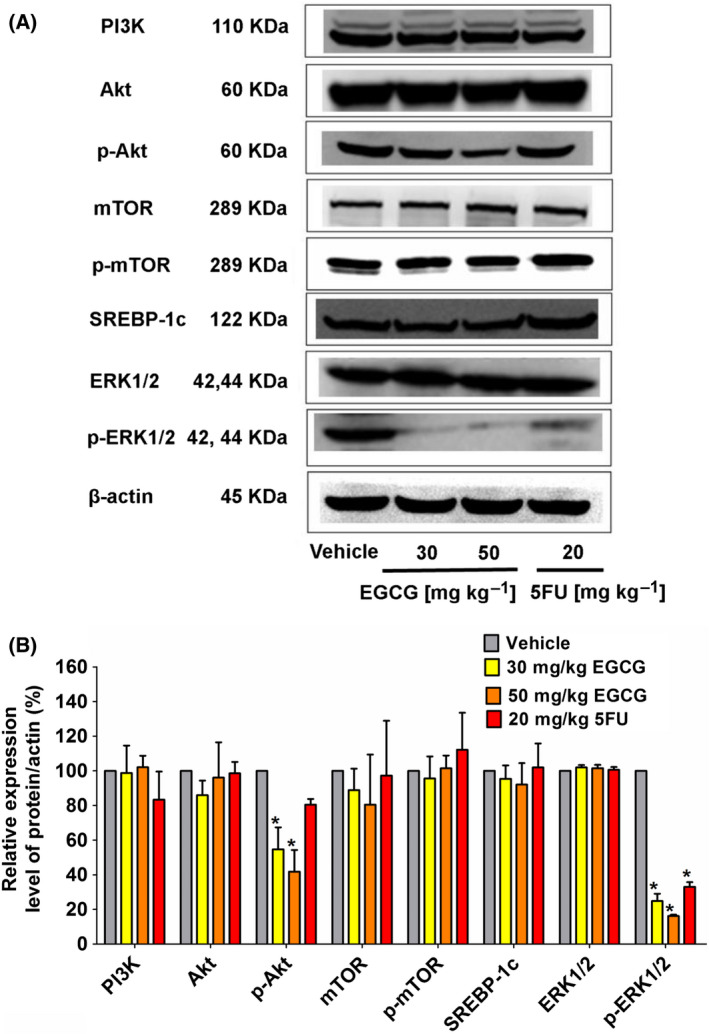
Fig. 6.

The effect of EGCG on the upstream signaling PI3K/Akt/mTOR/SREBP‐1c and ERK pathways in HCT116 tumor xenografts of nude mice. (A) Representative immunoblotting shows expression proteins collected from five tumors in each group, which was quantitated in a histogram (B) compared to 100% of the control group. The values are presented as the mean ± SD. *P < 0.05 compared to the control using one‐way ANOVA with Tukey’s post‐hoc analysis.
