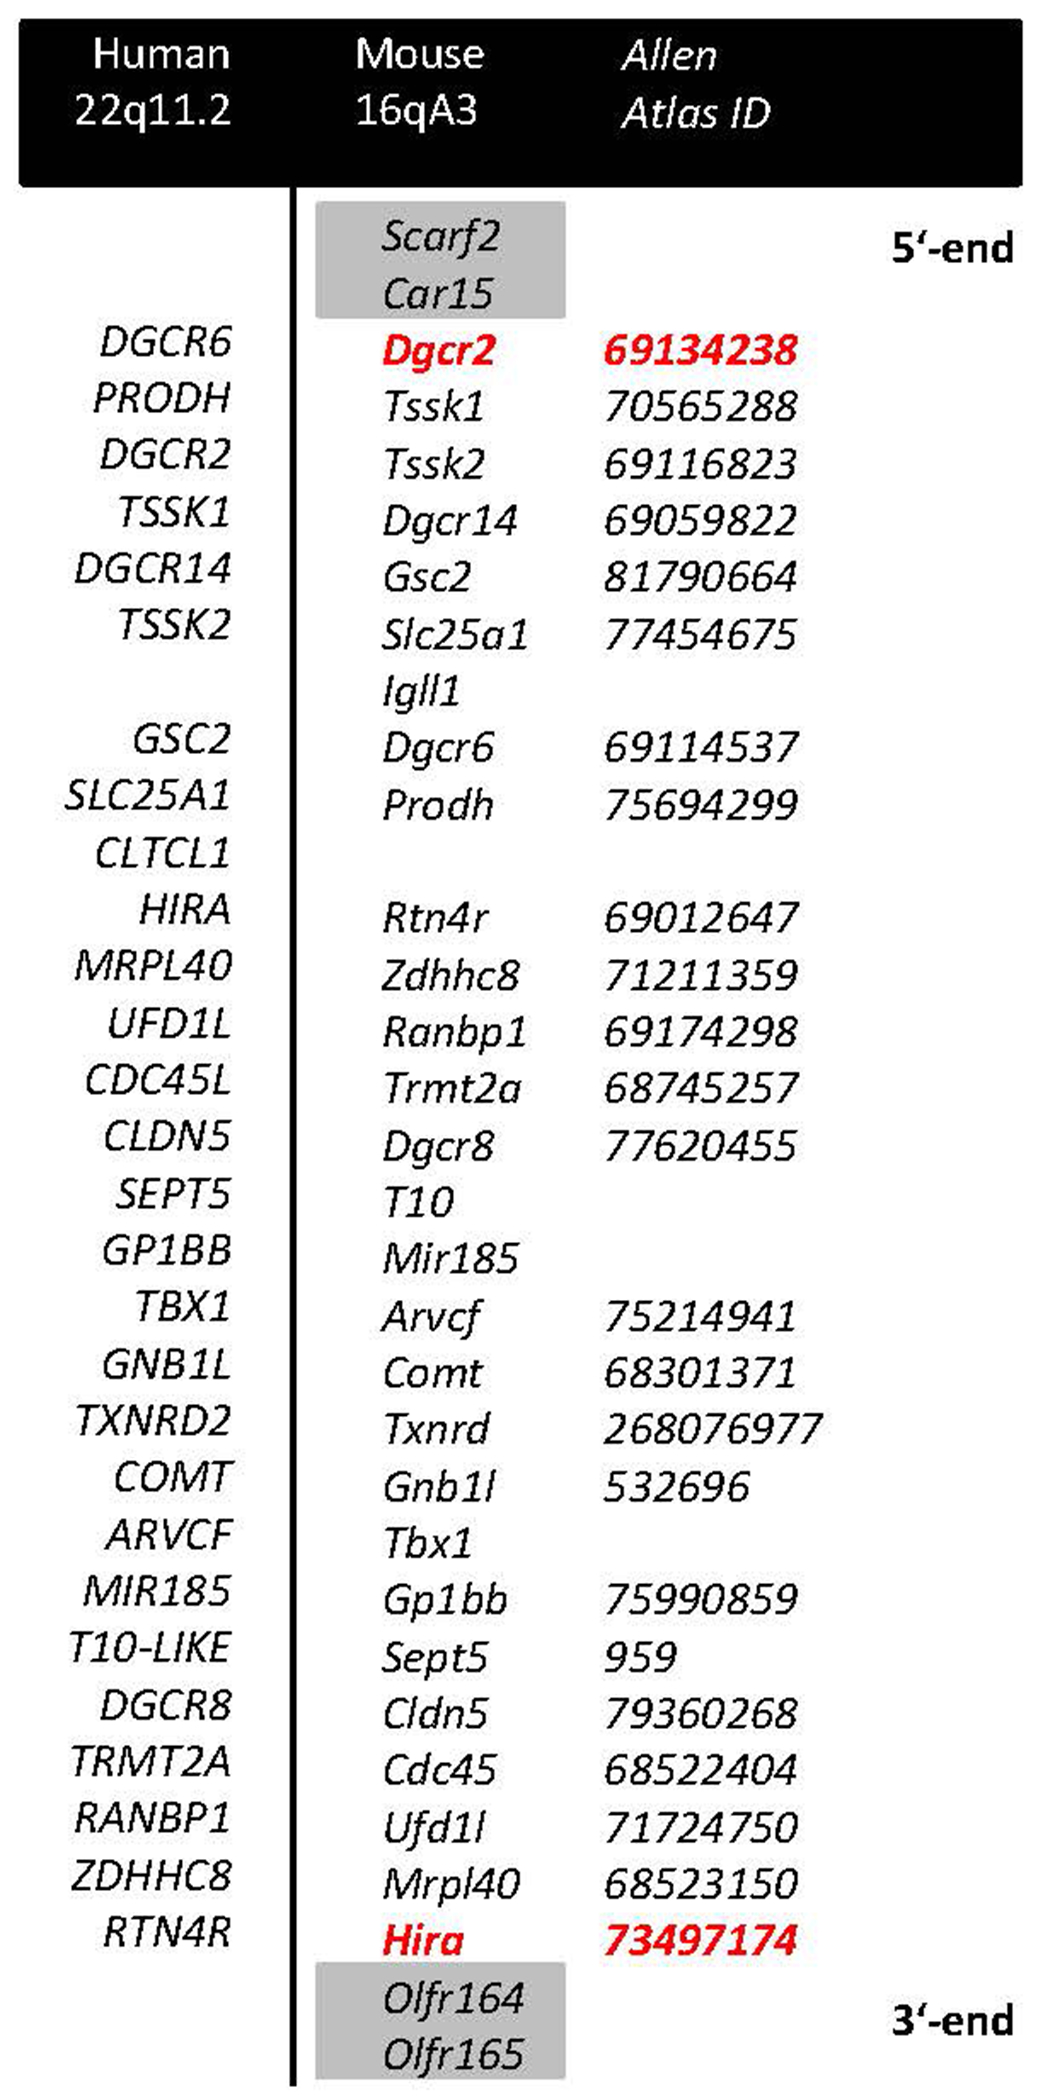
Figure 1. A schematic representation of deleted genes aligned for human (22q11.2) and mouse (16qA3) chromosomal regions.

Red color denotes genes targeted with a LoxP site, grey shade denotes genes at the border not comprising part of the deletion. IDs of the expression maps for the respective genes in the Allen Mouse Brain Atlas are reported in italics.
