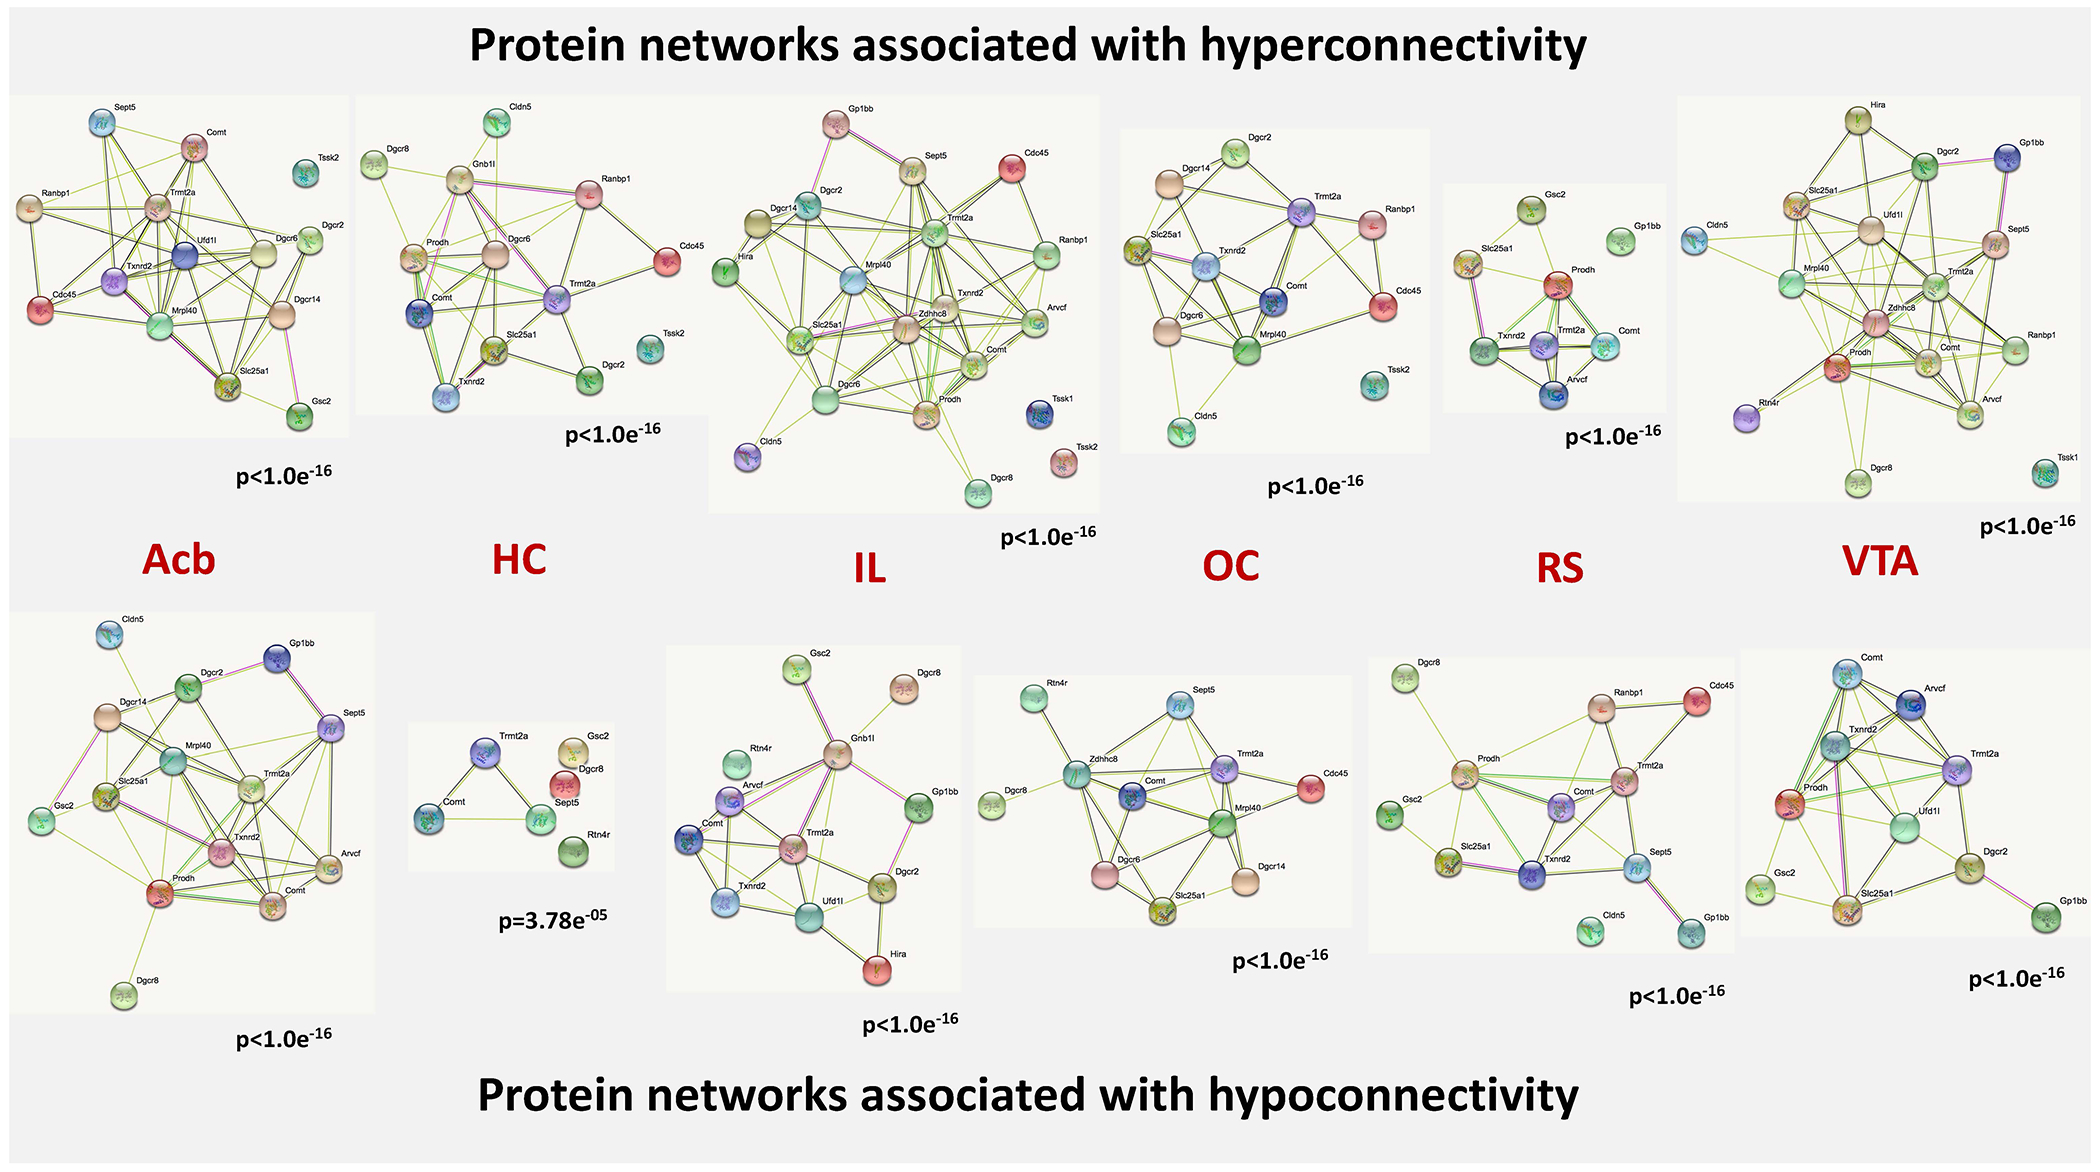
Figure 6. Protein-protein interaction networks overexpressed in networks indicating hyper- and hypoconnectivity.

The nodes of the network represent the proteins, which are encoded by the genes entered into our analysis. The content of the node indicates, whether the 3D structure of the gene product is known or not. The colors of the edges indicate the kind of evidence for protein-protein interactions. Nodes (proteins) without edges indicate that a protein has no functional associations with other proteins of that contrast. The p-values under the networks indicate the likelihood that the involved genes form a protein-protein network above chance level. Known interactions: light blue – from curated databases, pink – experimentally determined; predicted interactions: green – gene neighborhood, red – gene fusions, dark blue – gene co-occurrence; other interactions: light green – text mining, black – co-expression, violet – protein homology. Abbreviations: Acb - nucleus accumbens, HC - hippocampus, IL - infralimbic cortex, OC - orbitofrontal cortex, RS - retrosplenial cortex, VTA - ventral tegmental area.
