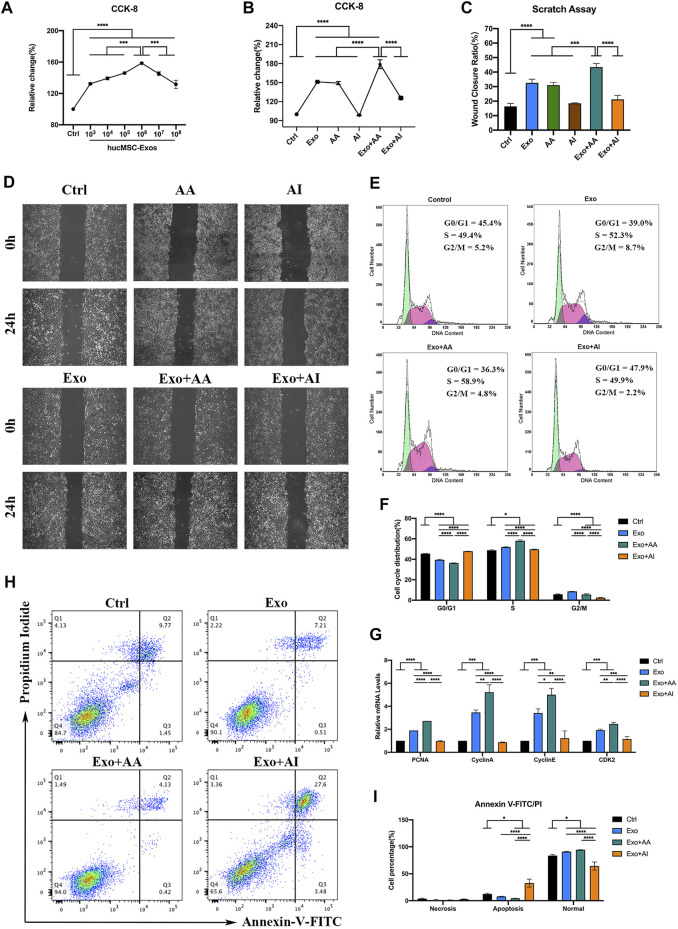
FIGURE 3.
Effects of the combination of hucMSC-Exos and autophagy regulators on HCECs. (A) Cell-counting Kit-8 (CCK-8) assay for cell viability of HCECs incubated with different concentrations of hucMSC-Exos for 24 h (B) CCK-8 assay for cell viability of HCECs in Control, Exo, AA, AI, Exo + AA and Exo + AI groups for 24 h. (C,D) Scratch assay results for cell migration rates of HCECs in Control, Exo, AA, AI, Exo + AA and Exo + AI groups for 24 h. Scale bar: 250 μm. (E,F) Flow cytometry results for cell cycle composition of HCECs after combination treatment with hucMSC-Exos and autophagy regulators for 24 h. (G) Quantitative PCR results for mRNA expression of PCNA, Cyclin A, Cyclin E and CDK2 in HCECs. (H, I) Apoptosis assay results showing the proportion of HCECs at each phase after the treatment with hucMSC-Exos combined with autophagy regulators for 24 h. Data are shown as mean ± SD. *p < 0.05, **p < 0.01, ***p < 0.001, ****p < 0.0001. (Control: HCECs treated with PBS, Exo: HCECs treated with 1 × 10⁶/μl hucMSC-Exos, Exo + AA: HCECs treated with 1 × 10⁶/μl hucMSC-Exos and 50 nM Rapamycin, Exo + AI: HCECs treated with 1 × 10⁶/μl hucMSC-Exos and 5 μM Compound C).

