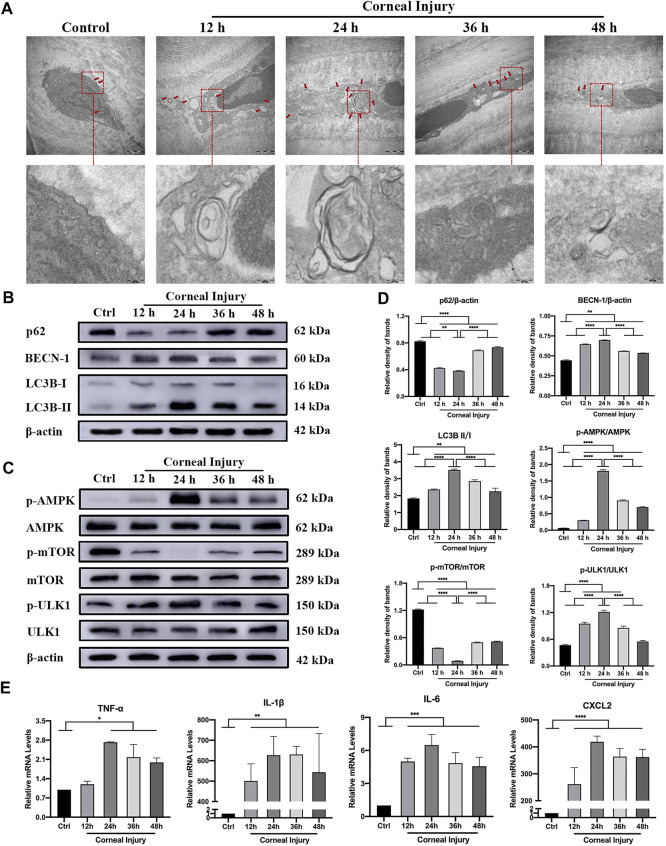
FIGURE 4.
Autophagy and inflammation in the corneas of corneal injury (CI) mice. (A) Representative high magnification TEM pictures showing autophagosomes with double membrane structure were formed in CI models. Scale bar: 500 and 100 nm. (B) Western blotting showing expressions of the autophagy marker proteins p62, Beclin-1, and LC3B. (C) Western blotting showing the expression of the AMPK-mTOR-ULK1 autophagy flux pathway proteins pAMPK, AMPK, pULK1, ULK1, pmTOR and mTOR. (D) Relative band densities of p62, Beclin-1, LC3BII/I, and the ratios of pAMPK/AMPK, pULK1/ULK1, and pmTOR/mTOR. (E) Quantitative PCR results for mRNA levels of the inflammatory cytokines TNF-α, IL-1β, IL-6, and CXCL-2. Data are shown as mean ± SD. *p < 0.05, **p < 0.01, ***p < 0.001, ****p < 0.0001.

