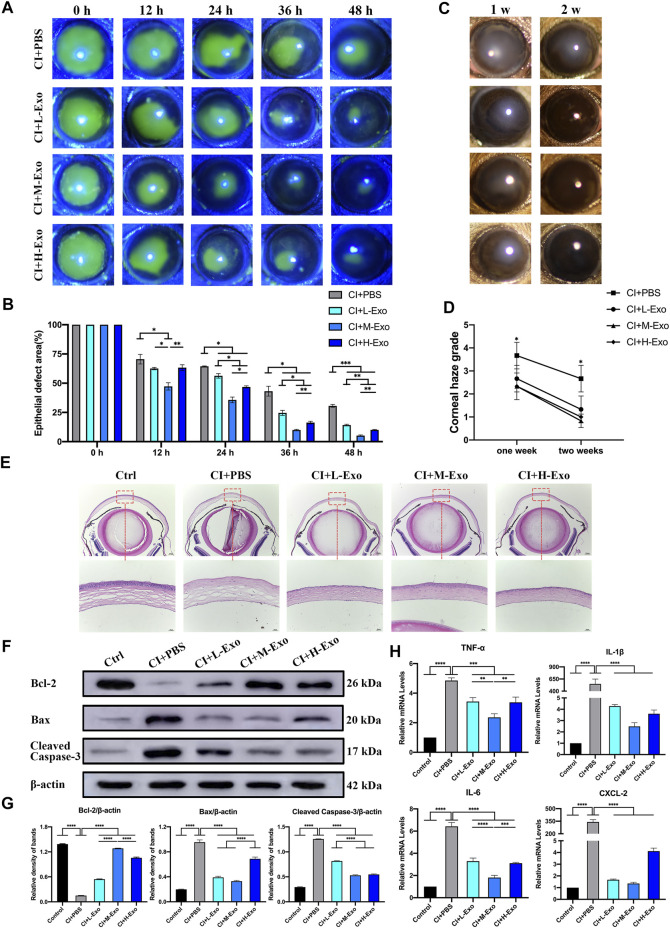
FIGURE 5.
Effect of hucMSC-Exos on CI mouse corneas. (A,B) Cornea fluorescein staining; representative images of the corneal epithelial defect areas. Data are quantified in the bar graph. (C,D) Slit lamp showing the representative images of corneal haze. Haze grading data are quantified in line chart. (E) Mouse eyeballs were harvested at 48 h post-injury. HE staining for histologic structure of cornea wound healing. Scale bar: 250 and 50 μm. (F,G) Western blotting showing the apoptosis related proteins Bcl-2, Bax, and cleaved Caspase-3. Relative band densities are quantified in bar graphs. (H) Quantitative PCR results for mRNA levels of the inflammatory cytokines TNF-α, IL-1β, IL-6, and CXCL-2, and quantified in bar graphs. Data are shown as mean ± SD. *p < 0.05, **p < 0.01, ***p < 0.001, ****p < 0.0001. (Control: normal corneas treated with PBS, CI + PBS: injured corneas treated with PBS, CI + L-Exo: injured corneas treated with 1 × 10⁵/μl hucMSC-Exos, CI + M-Exo: injured corneas treated with 1 × 10⁶/μl hucMSC-Exos, CI + H-Exo: injured corneas treated with 1 × 10⁷/μl hucMSC-Exos).

