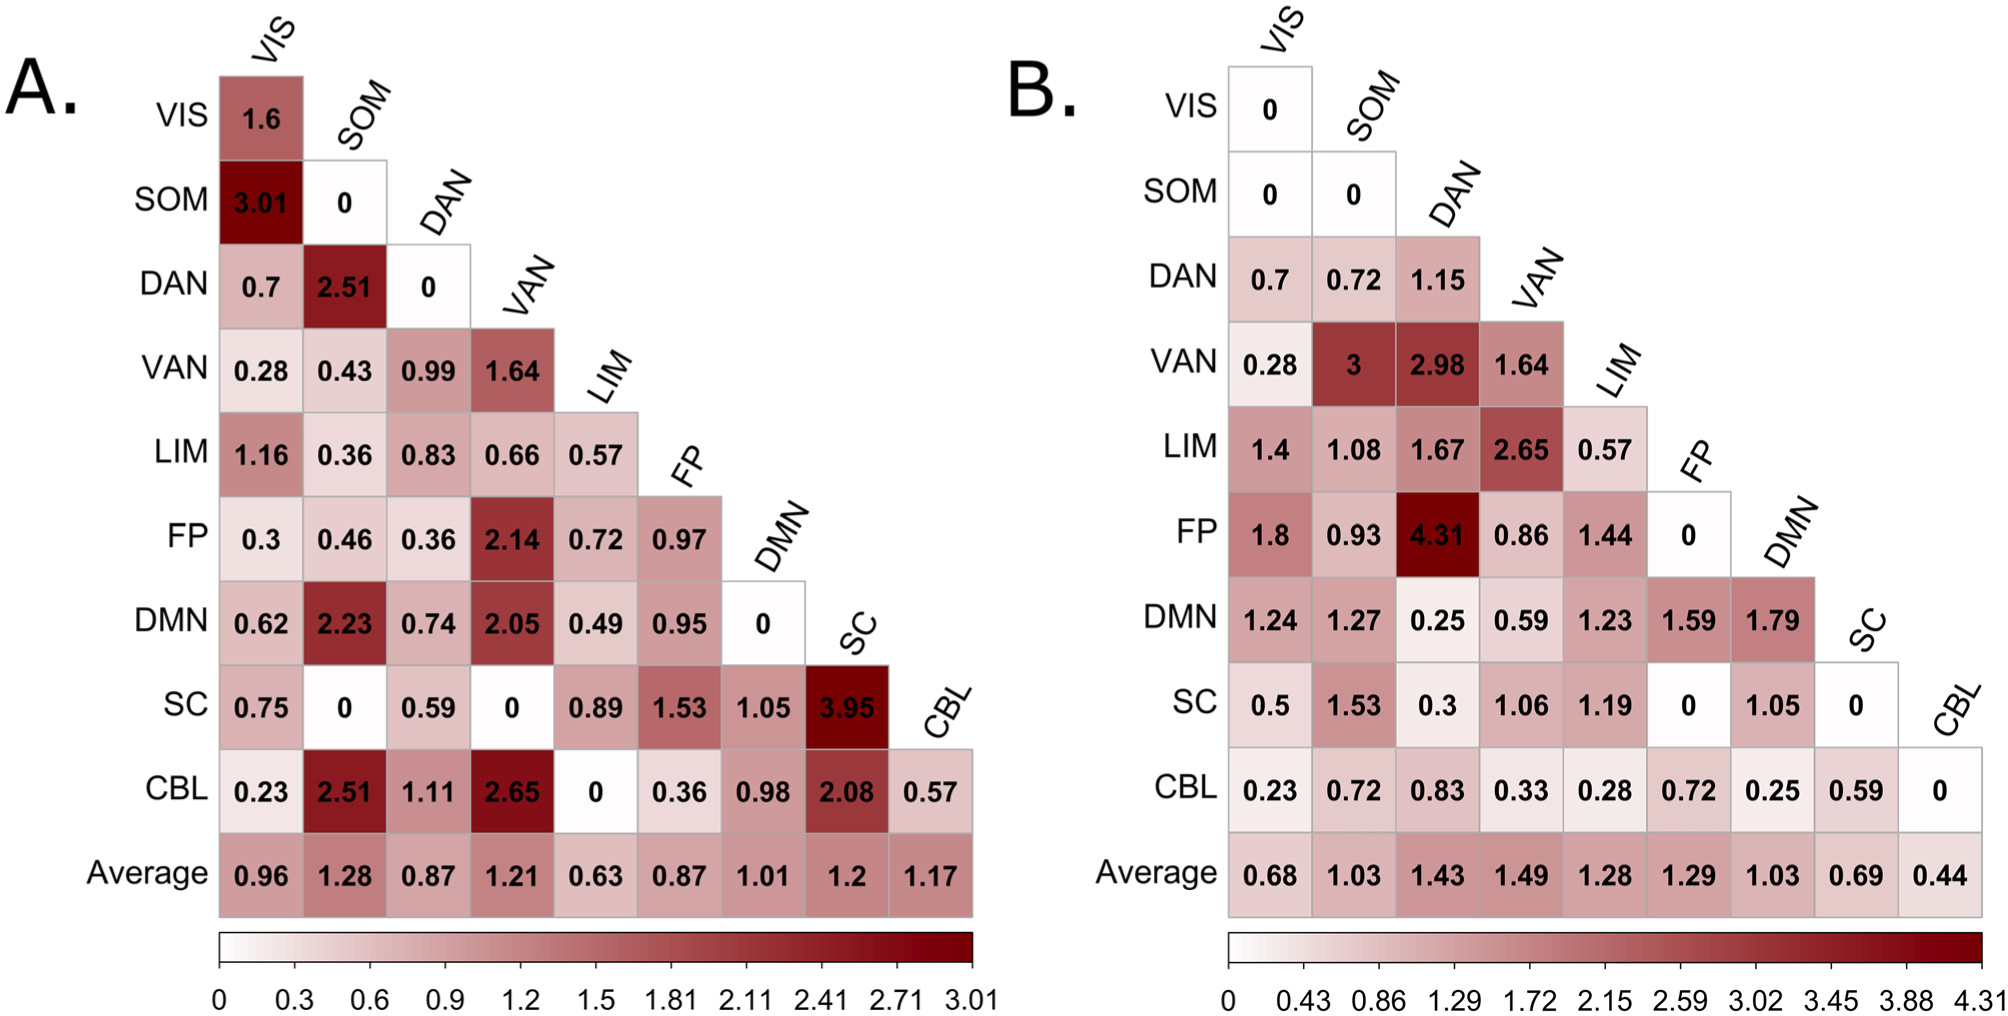
Fig. 4.

Relative contribution of each canonical network to model performance. The predictive edge counts were normalized between and within each possible pair of networks to account for network sizes (see Anatomical Distribution of Predictive Edges). Overrepresented networks were identified as those with values > 1. Representation of each network in the A) High RT_CV, and B) Low RT_CV. CBL: cerebellar network; DAN: dorsal attention network, DMN: default mode network, FP: frontoparietal network, LIM: limbic network; SOM: somatomotor network; SC: subcortical, VAN: ventral attention network; VIS: visual attention network; RT_CV: Reaction time coefficient of variation.
