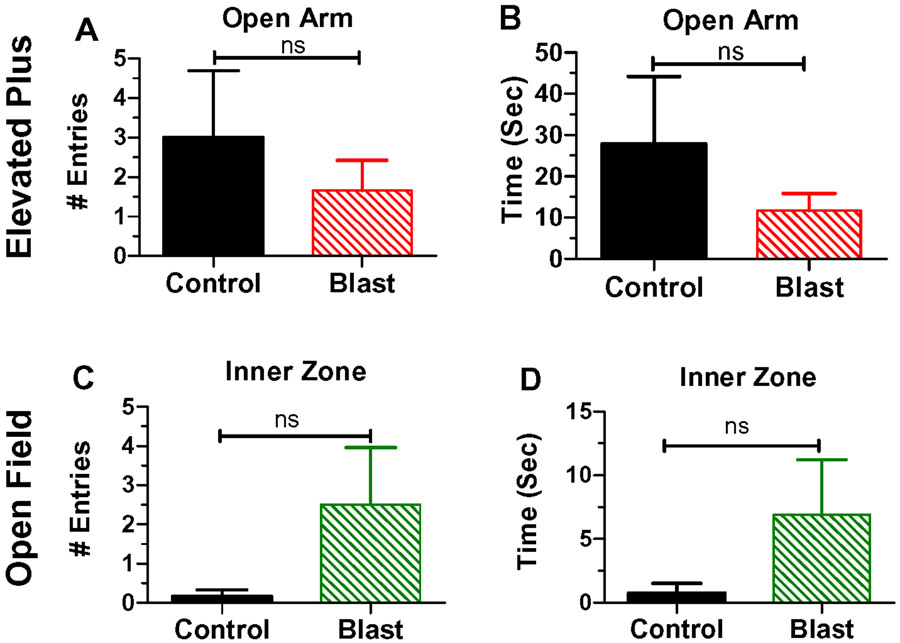
Figure 7:
Elevated Plus Maze (EPM) results in upper row. (A) Mean (+SEM) numbers of entries into the open arm of the EPM; no significant difference exits between rats in Control groups(n=6) and Blast Wave group (n=6). (B) Mean (+SEM) times in seconds spent in the open arm of EPM; no significant (ns) difference exits between rats in the Control group (n=6) and Blast Wave group (n=6). Open Field (OF) results shown in lower row. (C) Mean (+SEM) numbers of entries into the inner zone of the OF; no significant (ns) difference exists between rats in the Control group (n=6) and Blast Wave group (n=6). (D) Mean (+SEM) time in seconds spent in inner zone of OF; no significant (ns) difference exits between Control group (n=6) and Blast Wave (n=6) group.

