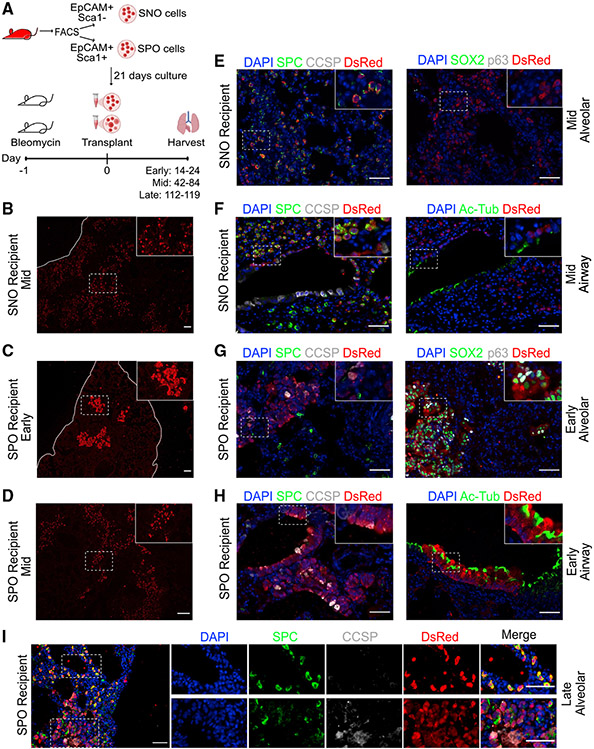
Figure 1. Lung organoid cells are retained in distinct lung compartments after transplantation.
(A) Experimental strategy for transplantation of lung organoid cells in pre-conditioned mouse lungs.
(B) Representative picture of IF staining on mouse lung transplanted with SNO cells and harvested at a middle time point. Red, DsRed. Scale bar represents 100 μm.
(C) Representative pictures of IF staining on mouse lungs transplanted with SPO cells and harvested at an early time point. Red, DsRed. Scale bar represents 100 μm.
(D) Representative pictures of IF staining on mouse lungs transplanted with SPO cells and harvested at a middle time point. Red, DsRed. Scale bar represents 100 μm.
(E and F) Representative pictures of IF staining on mouse lungs transplanted with SNO cells and harvested at a middle time point. Images show cells retained in the (E) distal alveolar region or (F) airway region. (E and F) Left: blue, DAPI; green, SPC; gray, CCSP; red, DsRed. (E) Right: blue, DAPI; green, SOX2; gray, p63; red, DsRed. (F) Right: blue, DAPI; green, Ac-Tub; red, DsRed. Scale bars represent 50 μm.
(G and H) Representative pictures of IF staining on mouse lungs transplanted with SPO cells and analyzed at an early time point. Images show cells retained in the (G) distal alveolar region or (H) airway region. (G and H) Left: blue, DAPI; green, SPC; gray, CCSP; red, DsRed. (G) Right: blue, DAPI; green, SOX2; gray, p63; red, DsRed.
(H) Right: blue, DAPI; green, Ac-Tub; red, DsRed. Scale bars represent 50 μm.
(I) Representative pictures of IF staining on mouse lungs transplanted with SPO cells and harvested at a late time point. Top inset depicts areas that express the alveolar marker SPC. Bottom inset depicts areas that express the airway marker CCSP but also express SPC. Blue, DAPI; green, SPC; gray, CCSP; red, DsRed. Scale bars represent 50 μm.
See also Figure S1.

