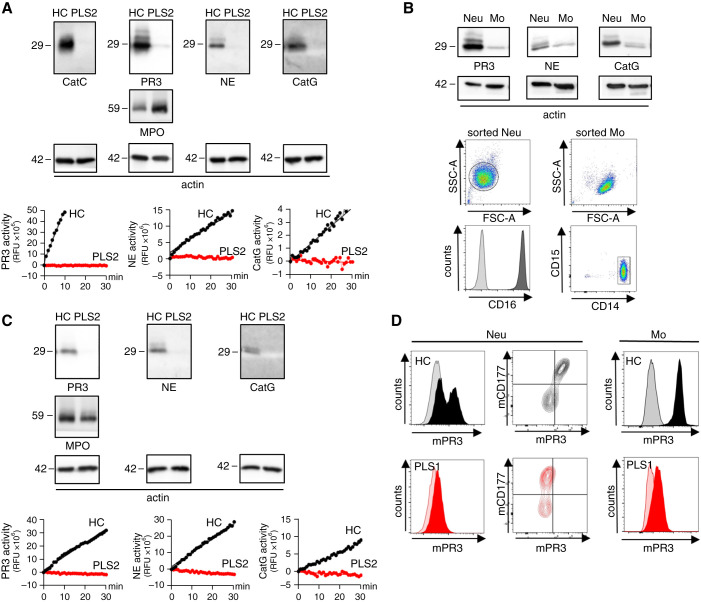
Figure 1.
NSPs are strongly decreased in and on the surface of neutrophils and monocytes from patients with CatC gene-deficient PLS. (A) CatC, NE, PR3, and CatG in isolated blood neutrophils from an HC and a patient with PLS (PLS) by immunoblotting and by protease-specific FRET assays. MPO served as control and 42 kDa actin indicates equal sample loading. (B) NSP proteins in highly pure sorted HC monocytes (Mo) and neutrophils (Neu) by immunoblotting. Flow cytometry documents the purity of the sorted neutrophils and monocytes. (C) NSP protein expression and proteolytic activity in CD14hi sorted HC and PLS monocytes. (D) Flow cytometry of neutrophils stained for mPR3 and CD177. mPR3 expression on CD11bpos/CD14hi/CD15neg blood monocytes from an HC and a patient with PLS by flow cytometry.

