Figure 6.
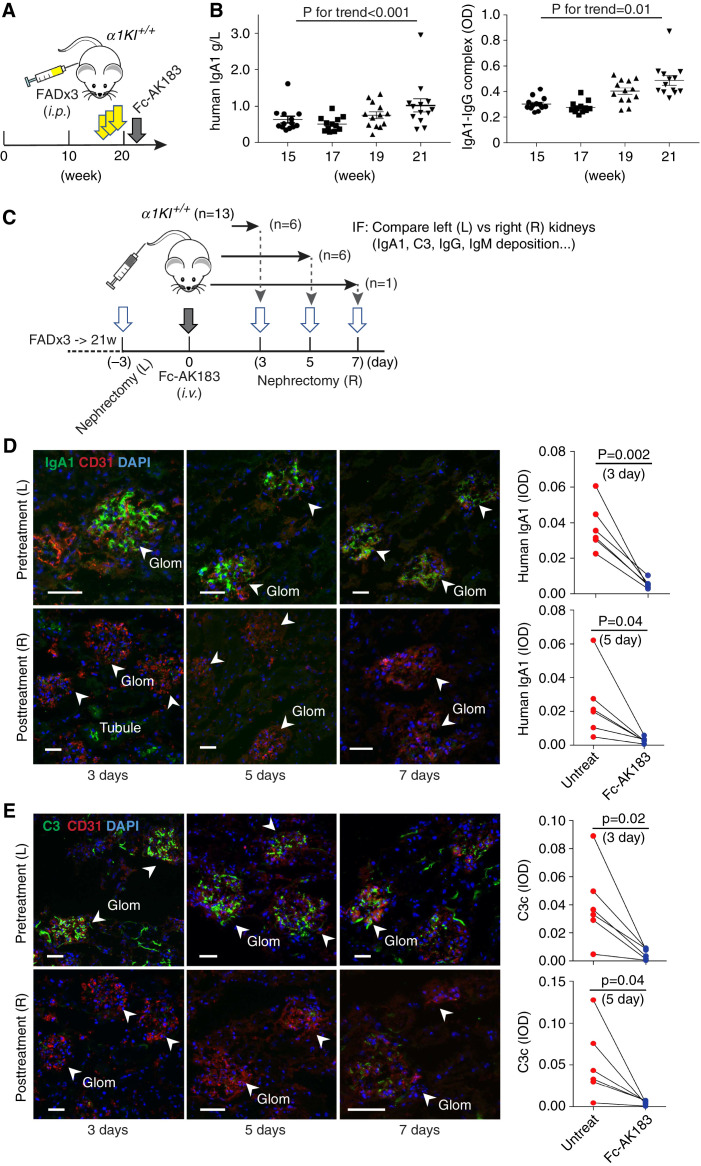
Recombinant Fc-AK183 removed chronic IgA1 deposits in α1KI-Tg mice. (A) Despite transgenic expression of human IgA1, α1KI mice did not develop glomerular deposition (not shown). Instead, we subjected homozygous α1KI+/+ mice to three rounds of ip injections with FAD at 15, 17, and 19 weeks of age (yellow arrows). These adjuvant-primed mice showed IgAN-like glomerular deposition of IgA1 in the following weeks, during which a single iv dose of Fc-AK183 (gray arrow) was injected into each mouse at 21 weeks to evaluate the effect on IgA1 deposits. (B) Blood levels of total IgA1 and IgA1-IgG complexes were measured by ELISA (see Methods section) between 15 and 21 weeks of age, showing trends of significant increases. (C) After adjuvant induction, α1KI+/+-Tg mice (n=13) were subjected to unilateral nephrectomy of the left (L) kidneys in week 21. Three days later, each mouse was treated with an iv injection of Fc-AK183 (denoted as day 0). Six mice were subsequently euthanized to collect the post-treatment right (R) kidneys 3 days after Fc-AK183 administration, with another six mice collected at post-treatment day 5 and one more at post-treatment day 7. Cryosections of all collected kidneys were processed together for immunofluorescence (IF) detection of IgA1 deposition in association with C3, IgG, and IgM. (D) Representative IF images of paired pretreatment (L) versus post-treatment (R) kidneys of the same animal are shown (top and bottom images for paired kidneys). Before Fc-AK183 treatment, all kidneys showed varying levels of human IgA1 deposits in the glomerulus (top images: arrowheads; scale bar, 30 μm). In contrast, few IgA1 deposits were observed 3, 5, or 7 days after treatment with Fc-AK183 (bottom images). Quantitative comparisons (same animal connected by a line) of kidneys pre- and post-treatment are shown in the right panels. (E) Similarly, the same mice (top versus bottom images) were used for detecting complement C3c deposits in the glomerulus. Coinciding with the complete removal of IgA1 deposits (as in D), post-Fc-AK183 treatment also showed clearance of IgA1-associated C3c deposition in the glomerulus (follow arrows). Quantitative comparisons of kidneys pre- and post-treatment are shown in the right panels. Scale bar, 30 μm.

