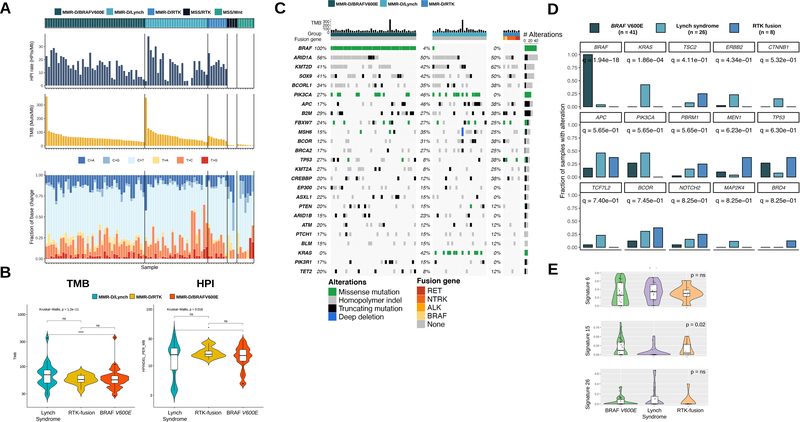
Figure 2.
A. Tumor mutational burden (TMB), homopolymer indel (HPI) frequency and base change spectrum in our identified groups: MMR-D: BRAF V600E mutated, Lynch syndrome and RTK fusions. MSS: RTK fusions and RSPO fusion. All three MMR-D subgroups have a higher TMB and HPI than MSS tumors with RTK or RSPO fusions. B. Lynch syndrome tumors demonstrate a higher TMB and HPI than MMR-D BRAF V600E tumors. Median TMB and HPI levels of MMR-D RTK fusion tumors are closer to MMR-D BRAF V600E tumors (text) but not significantly (ns) different from Lynch syndrome tumors, probably because of low case numbers. C. Co-mutation plot for the pre-defined groups. D. Varying frequencies of various oncogenes among the three MMR-D cancer subgroups. Q values for each oncogene are listed beneath their identifiers. Oncogenic mutations in KRAS, ERBB2 and CTNNB1 show relative predominance in Lynch syndrome. E. Lynch syndrome-associated MMR-D cancers demonstrate a lower median contribution from signature 15 than do BRAF V600E and RTK fusion-associated MMR-D cancers.

