. 2022 May 3;130(5):057002. doi: 10.1289/EHP10273

Figure 2.

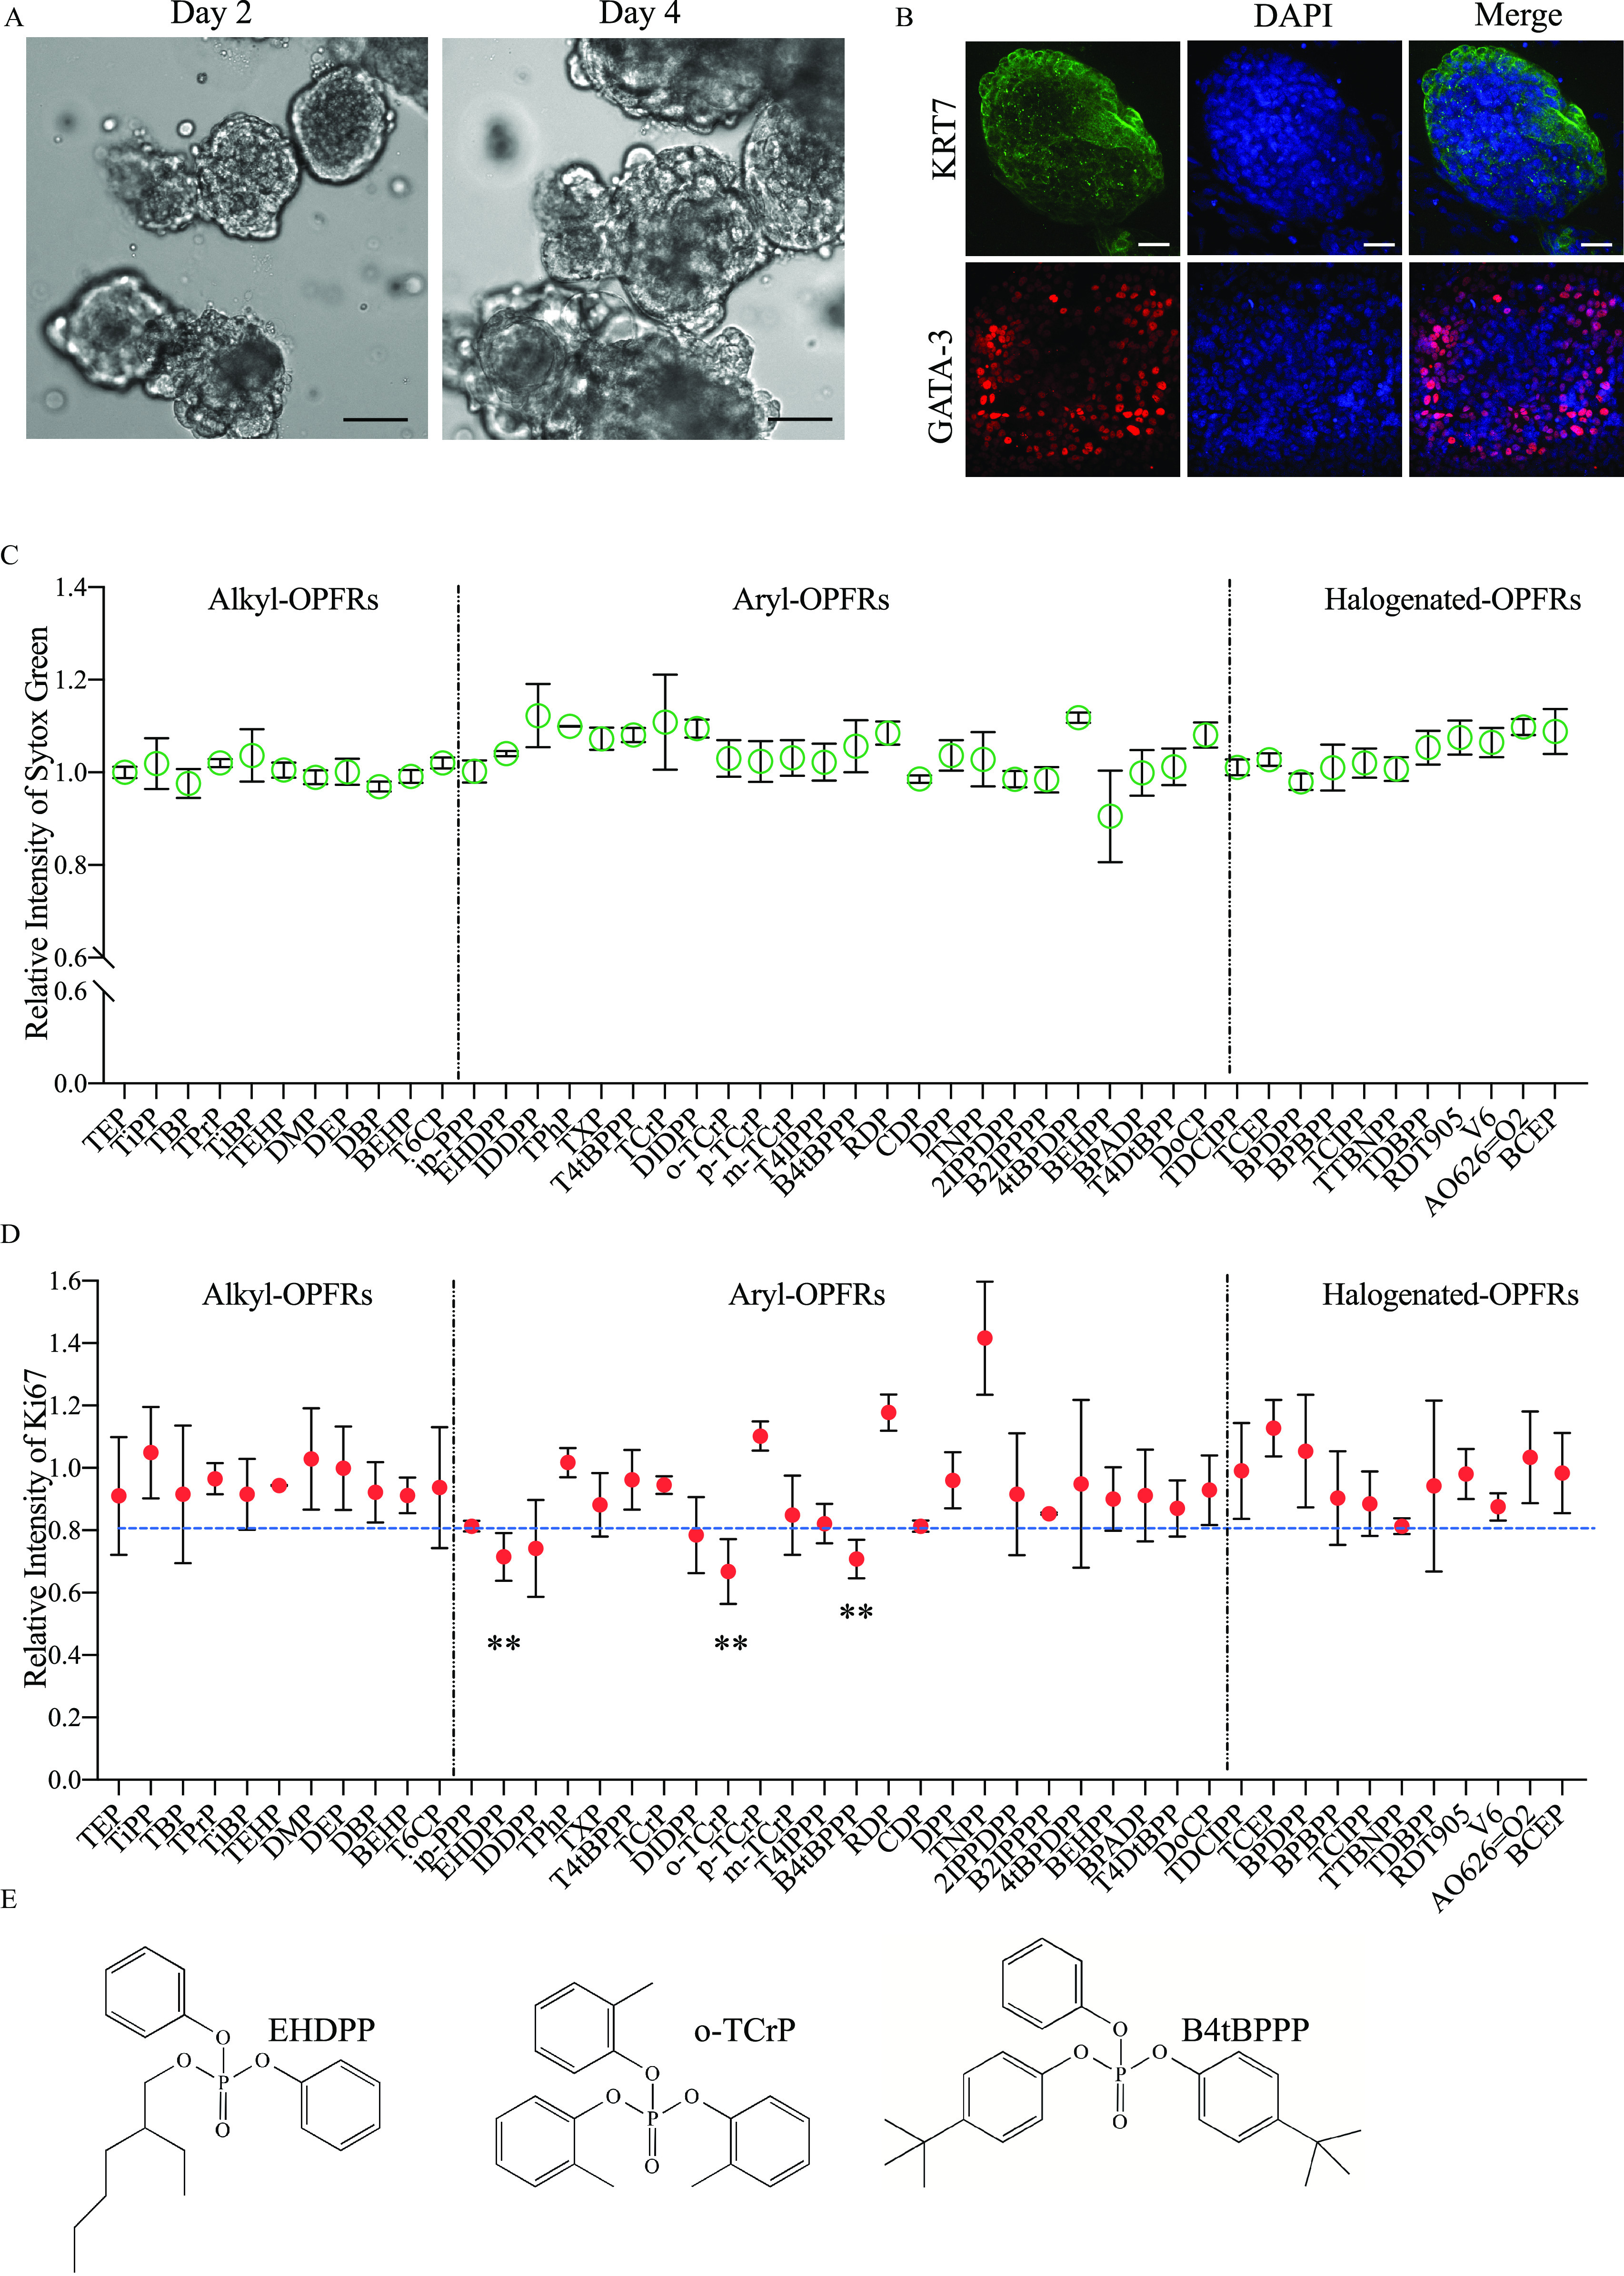
Figure 2A is a set of two Trophoblast organoid-based screenings depicting organophosphate flame retardants in mice on Day 2 and 4, respectively. Figure 2B is a stained tissue having three columns, namely, keratin 7, 4′,6-diamidino-2-phenylindole, and Merge, and two rows, namely, keratin 7 and G A T A-binding protein 3. Figure 2C is an error bar graph, plotting Relative Intensity of Sytox Green, ranging from 0.0 to 0.6 in increments of 0.5 and 0.6 to 1.4 in increments of 0.2 (y-axis) across T E P, Ti P P, T B P, T P r P, Ti B P, T E H P, D M P, D E P, D B P, B E H P, T 6 C P, ip-P P P, E H D P P, I D D P P, T Ph P, T X P, T 4 t B P P P, T Cr P, D I D P P, o-T Cr P, p-T Cr P, m-T Cr P, T 4 I P P P, B 4 t B P P P, R D P, C D P, D P P, T N P P, 2 I P P D P P, B 2 I P P P P, 4 t B P D P P, B E H P P, B P A D P, T 4 Dt B P P, Do C P, T D C I P P, T C E P, B P D P P, B P B P P, T C I P P, T T B N P P, T D B P P, R D T 905, V 6, A O 626 equals O 2, and B C E (x-axis) for Alkyl- organophosphate flame retardants, Aryl- organophosphate flame retardants, and Halogenated- organophosphate flame retardants. Figure 2D is an error bar graph, plotting Relative Intensity of Antigen K I-67, ranging from 0.0 to 1.6 in increments of 0.2 (y-axis) across T E P, Ti P P, T B P, T P r P, Ti B P, T E H P, D M P, D E P, D B P, B E H P, T 6 C P, ip-P P P, E H D P P, I D D P P, T Ph P, T X P, T 4 t B P P P, T Cr P, D I D P P, o-T Cr P, p-T Cr P, m-T Cr P, T 4 I P P P, B 4 t B P P P, R D P, C D P, D P P, T N P P, 2 I P P D P P, B 2 I P P P P, 4 t B P D P P, B E H P P, B P A D P, T 4 Dt B P P, Do C P, T D C I P P, T C E P, B P D P P, B P B P P, T C I P P, T T B N P P, T D B P P, R D T 905, V 6, A O 626 equals O 2, and B C E (x-axis) for Alkyl- organophosphate flame retardants, Aryl- organophosphate flame retardants, and Halogenated- organophosphate flame retardants. Figure 2E is a set of three chemical structures, including 2-Ethylhexyl di-Ph phosphate, o-T Cr P, and Bis(4-tert-butylphenyl) phenyl phosphate.

Trophoblast organoid-based screening of OPFRs at 10,000 nM. (A) 2- and 4-d culture of trophoblast organoids in screening protocol and scale bars, 100μm; (B) Immunofluorescence of villus markers KRT7 (green), GATA3 (red), and DAPI (blue) in trophoblast organoids and scale bars, 30μm; (C) Relative fluorescence intensity (means±SDs) of Sytox Green (green) in trophoblast organoids exposed to OPFRs (10,000 nM) (D) Relative fluorescence intensity (means±SDs) of Ki67 (red) in trophoblast organoids exposed to OPFRs (10,000 nM); (E) Structure of identified chemicals, EHDPP, o-TCrP, and B4tBPPP. Data in (C) and (D) are expressed relative to the levels in DMSO-treated organoids, which were set to 1. n=3. All organoids in (C) and (D) were from a single donor. Data were analyzed using an unpaired two-tailed Student’s t-test. Indicated values are significantly different from the control value. Numeric data in (C) and (D) were listed in Table S8. Note: B4tBPPP, bis (4-tertbutylphenyl) phosphate; DAPI, 4′,6-diamidino-2-phenylindole; DMSO, dimethylsulfoxide; EHDPP, 2-ethylhexyl-diphenyl phosphate; GATA3, GATA-binding protein 3; KRT7, keratin 7; OPFRs, organophosphate flame retardants; o-TCrP, tri-o-cresyl phosphate; SD, standard deviation. **p<0.01.