. 2022 May 3;130(5):057002. doi: 10.1289/EHP10273

Figure 4.

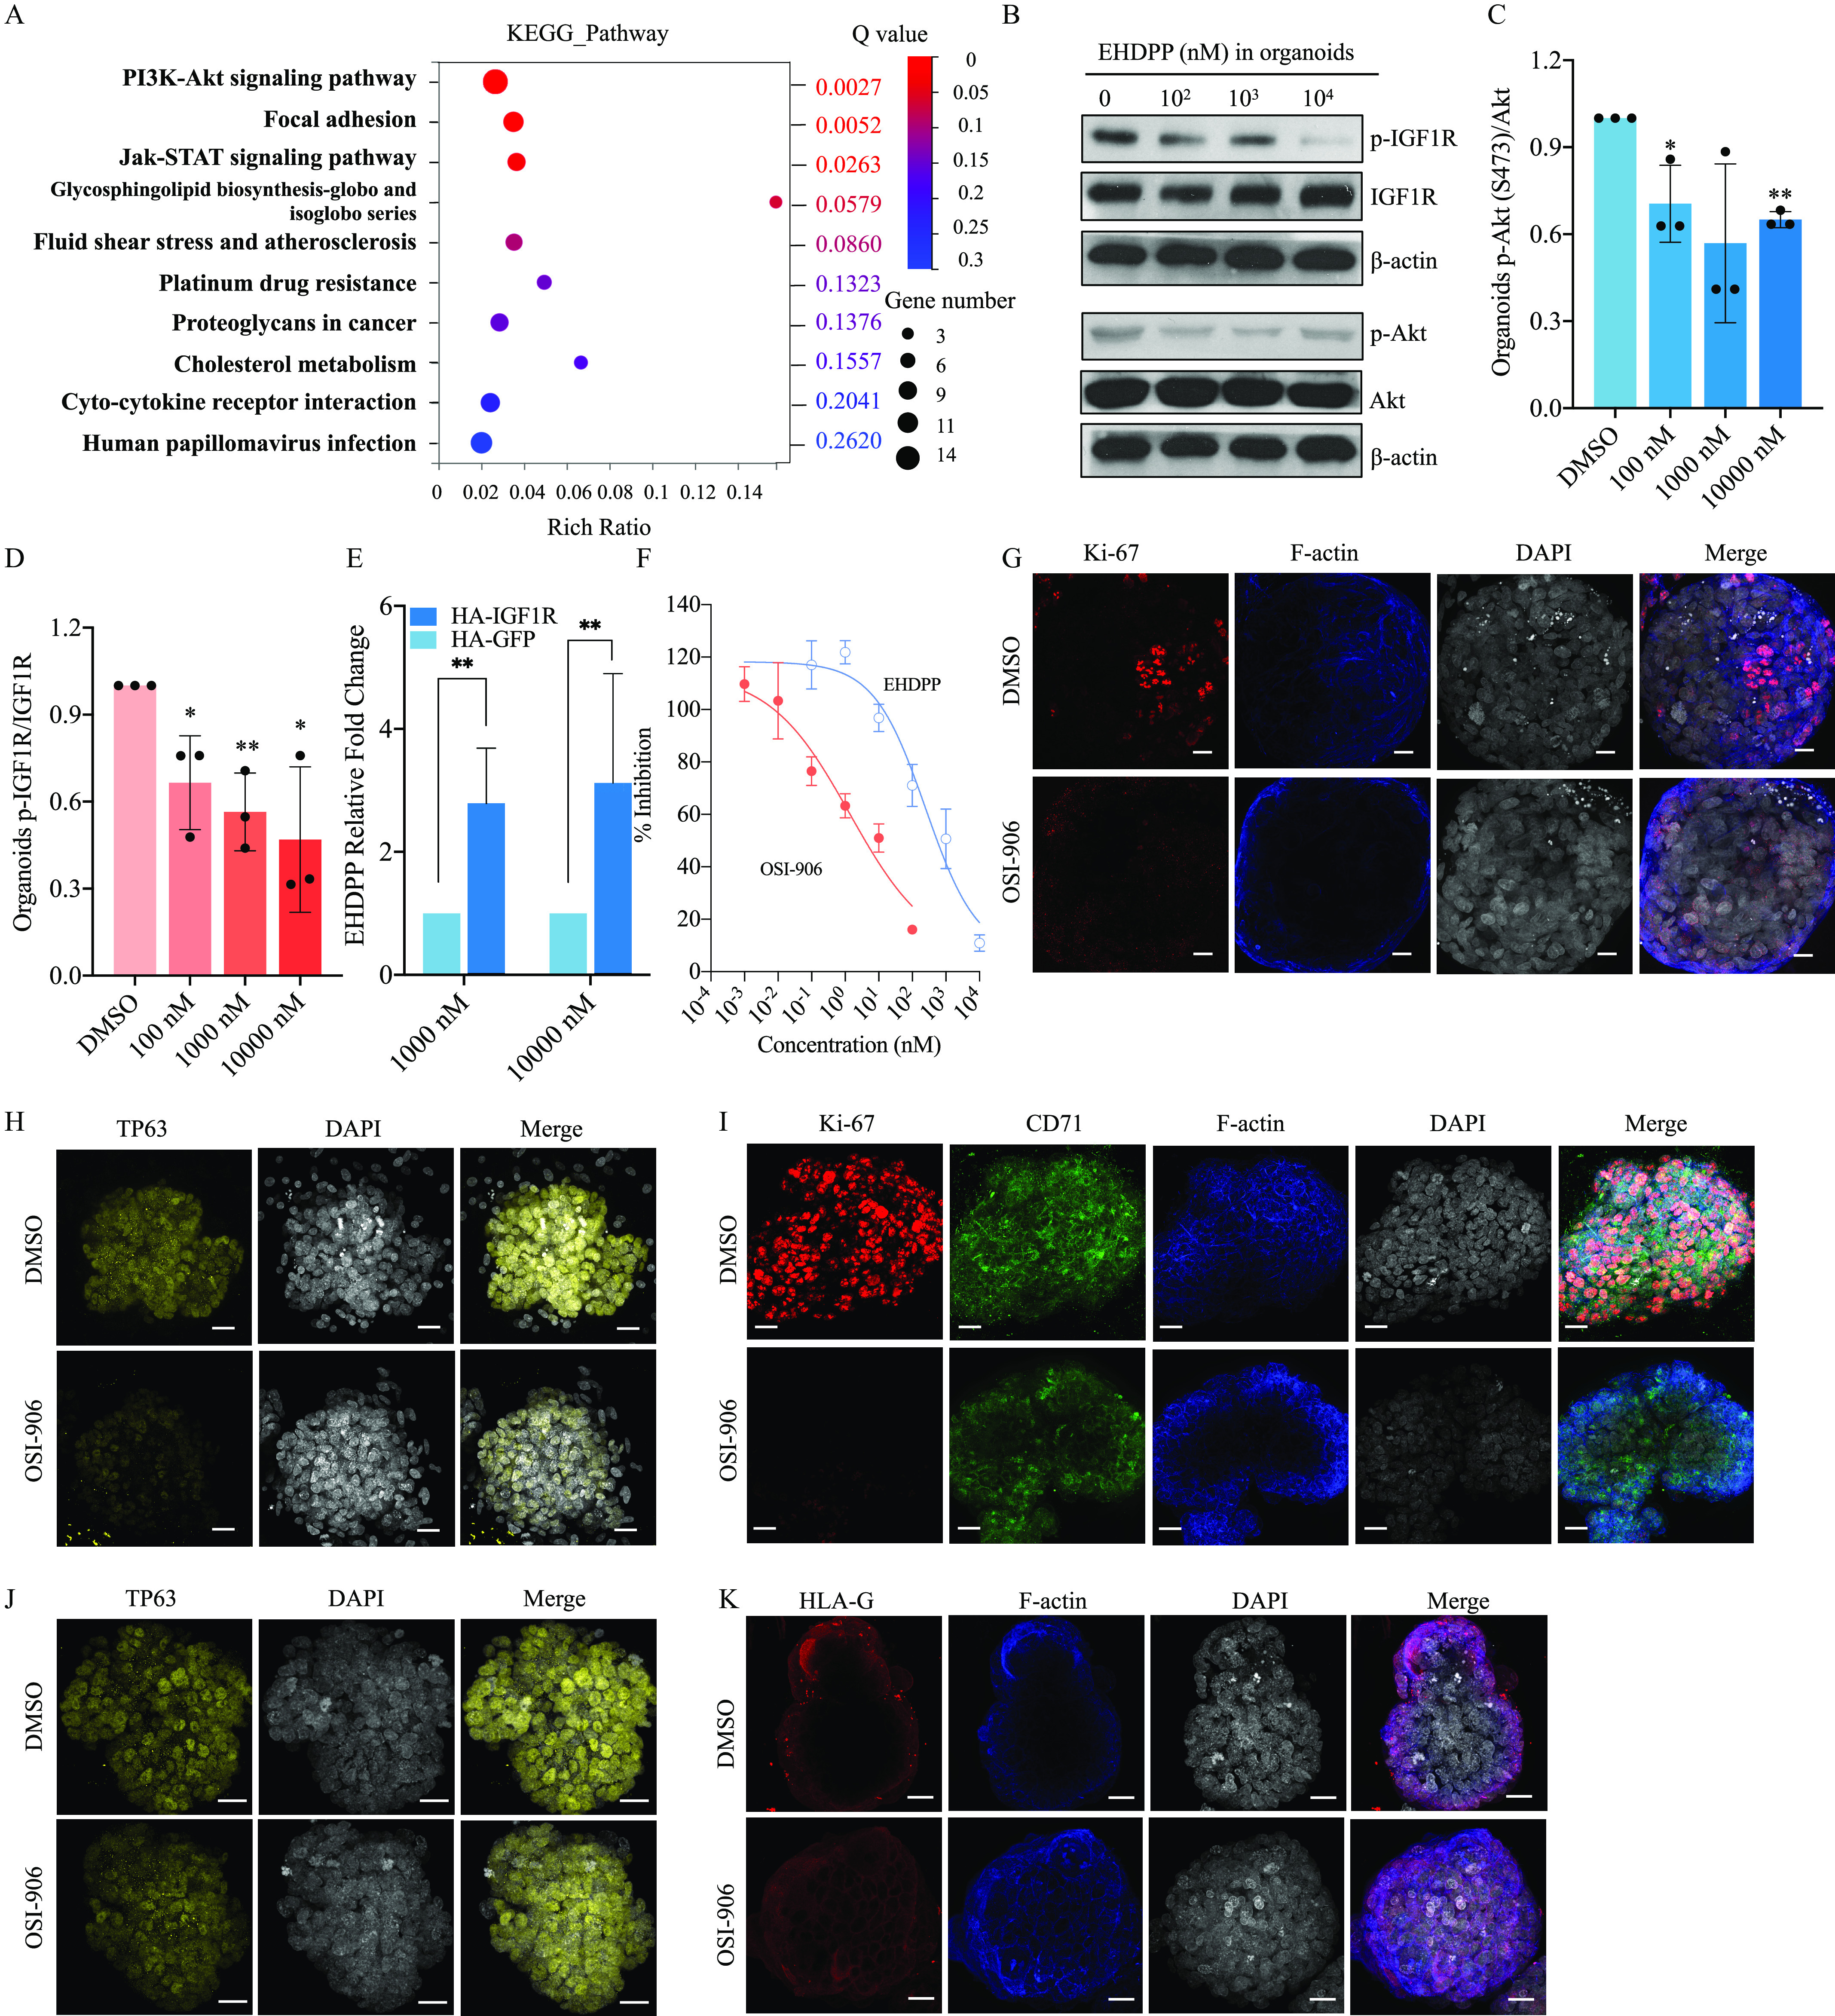
Figure 4A is a dot graph titled Kyoto Encyclopedia of Genes and Genomes Pathway, plotting Phosphatidylinositol 3-kinase - Protein kinase B signaling pathway, Focal adhesion, Janus Kinase and Signal Transducer and Activator of Transcription signaling pathway, Glycosphingolipid biosynthesis-globo and isoglobo series, Fluid shear stress and atherosclerosis, Platinum drug resistance, Proteoglycans in cancer, Cholesterol metabolism, Cyto-cytokine receptor interaction, and Human papillomavirus infection (left y-axis) and Uppercase q value, ranging as 0.2620, 0.2041, 0.1557, 0.1376, 0.0860, 0.0579, 0.0263, 0.0052, and 0.0027 (right y-axis) across Rich Ratio, ranging from 0 to 0.14 in increments of 0.02 (x-axis). A scale depicting uppercase q value is ranging from 0.3 to 0 in increments of 0.05. A scale depicting gene number is ranging from 14 to 11 in decrements of 3, 11 to 9 in decrements of 2, 9 to 3 in decrements of 3. Figure 4B is a western blot displays 0, 10 begin superscript 2 end superscript, 10 begin superscript 3 end superscript, and 10 begin superscript 4 end superscript in 2-ethylhexyl-diphenyl phosphate (nanomolar) in organoids as columns and phosphorylated-insulin growth factor 1 receptor, insulin growth factor 1 receptor, lowercase beta-actin, phosphorylated-Protein kinase B, Protein kinase B, and lowercase beta actin as rows. Figures 4C and 4D are bar graphs, plotting Organoids Phosphorylated-Protein kinase B (serine 473) per Protein kinase B and Organoids phosphorylated-insulin growth factor 1 receptor per insulin growth factor 1 receptor, ranging from 0.0 to 1.2 in increments of 0.3 (y-axis) across dimethyl sulfoxide, 100 nanomolar, 1000 nanomolar, and 10000 nanomolar (x-axis). Figure 4E is a bar graph, plotting 2-ethylhexyl-diphenyl phosphate relative fold change, ranging from 0 to 6 in increments of 2 (y-axis) across 1000 nanomolar and 10000 nanomolar (x-axis) for Human-insulin growth factor 1 receptor and human-green fluorescent protein. Figure 4F is a line graph, plotting percentage inhibition, ranging from 0 to 140 in increments of 20 (y-axis) across concentration (nanomolar), ranging as 10 begin superscript negative 4 end superscript, 10 begin superscript negative 3 end superscript, 10 begin superscript negative 2 end superscript, 10 begin superscript negative 1 end superscript, 10 begin superscript 0 end superscript, 10 begin superscript 1 end superscript, 10 begin superscript 2 end superscript, 10 begin superscript 3 end superscript, and 10 begin superscript 4 end superscript (x-axis) for 2-ethylhexyl-diphenyl phosphate and linsitinib. Figure 4G is a stained tissue having four columns, namely, Antigen K I-67, F-actin, 4′,6-diamidino-2-phenylindole, and Merge, and two rows, namely, dimethyl sulfoxide and linsitinib. Figures 4H and 4J are stained tissues having three columns, namely, tumor protein 63, 4′,6-diamidino-2-phenylindole, and Merge, and two rows, namely, dimethyl sulfoxide and linsitinib. Figure 4I is a stained tissue having five columns, namely, Antigen K I-67, transferrin receptor, F-actin, 4′,6-diamidino-2-phenylindole, and Merge, and two rows, namely, dimethyl sulfoxide and linsitinib. Figure 4K is a stained tissue having four columns, namely, human leukocyte antigen protein-G, F-actin, 4′,6-diamidino-2-phenylindole, and Merge, and two rows, namely, dimethyl sulfoxide and linsitinib.

Investigating mechanisms of placentation disruption using organoids. (A) RNA-seq in Control and EHDPP (10,000 nM) exposure groups in trophoblast organoids; (B) Protein levels of p-IGF1R (Y1135), IGF1R, p-Akt (S473), Akt and β-actin in control and EHDPP exposure groups in trophoblast organoids; (C) Relative protein level (means±SDs) of p-Akt(Ser473)/Akt; (D) Relative protein level (means±SDs) of p-IGF1R/IGF1R; (E) Relative binding affinity of EHDPP (means±SDs); (F) In vitro kinase activity (means±SDs) of IGF1R of EHDPP and OSI-906 (50 nM); (G) Ki67 (red), F-actin (blue) and DAPI (gray) in control and 2-d OSI-906 (50 nM) exposure groups; (H) TP63 (yellow) and DAPI (gray) in control and 2-d OSI-906 (50 nM) exposure groups; (I) Ki67 (red), CD71 (green), F-actin (blue) and DAPI (gray) in control and 10-d OSI-906 (50 nM) exposure groups; (J) TP63 (red) and DAPI (gray) in control and 10-d OSI-906 (50 nM) exposure groups; (K) HLA-G (red), F-actin (blue) and DAPI (gray) in control and 10-d OSI-906 (50 nM) exposure groups. Data in (C–F) are expressed relative to the levels in DMSO-treated organoids, which were set to 1. n=3. All organoids in Figure 4 were from a single donor. Data were analyzed using an unpaired two-tailed Student’s t-test. Indicated values are significantly different from the control value. Scale bars, 20μm. Numeric data in (C), (D) and (E) are listed in Table S12. Numeric data in (F) are listed in Table S13. Note: Akt, protein kinases B; CD71, transferrin receptor; DAPI, 4′,6-diamidino-2-phenylindole; DMSO, dimethylsulfoxide; EHDPP, 2-ethylhexyl-diphenyl phosphate; HLA-G, human leukocyte antigen protein-G; IGF1R, insulin-like growth factor 1 receptor; OSI-906, linsitinib; RNA-seq, RNA sequencing; SD, standard deviation; TP63, tumor protein 63. *p<0.05. **p<0.01.