. 2022 May 3;130(5):057002. doi: 10.1289/EHP10273

Figure 5.

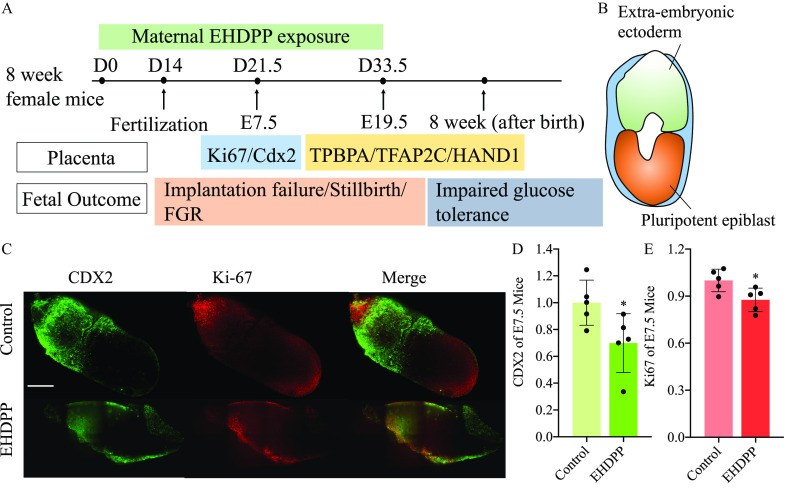
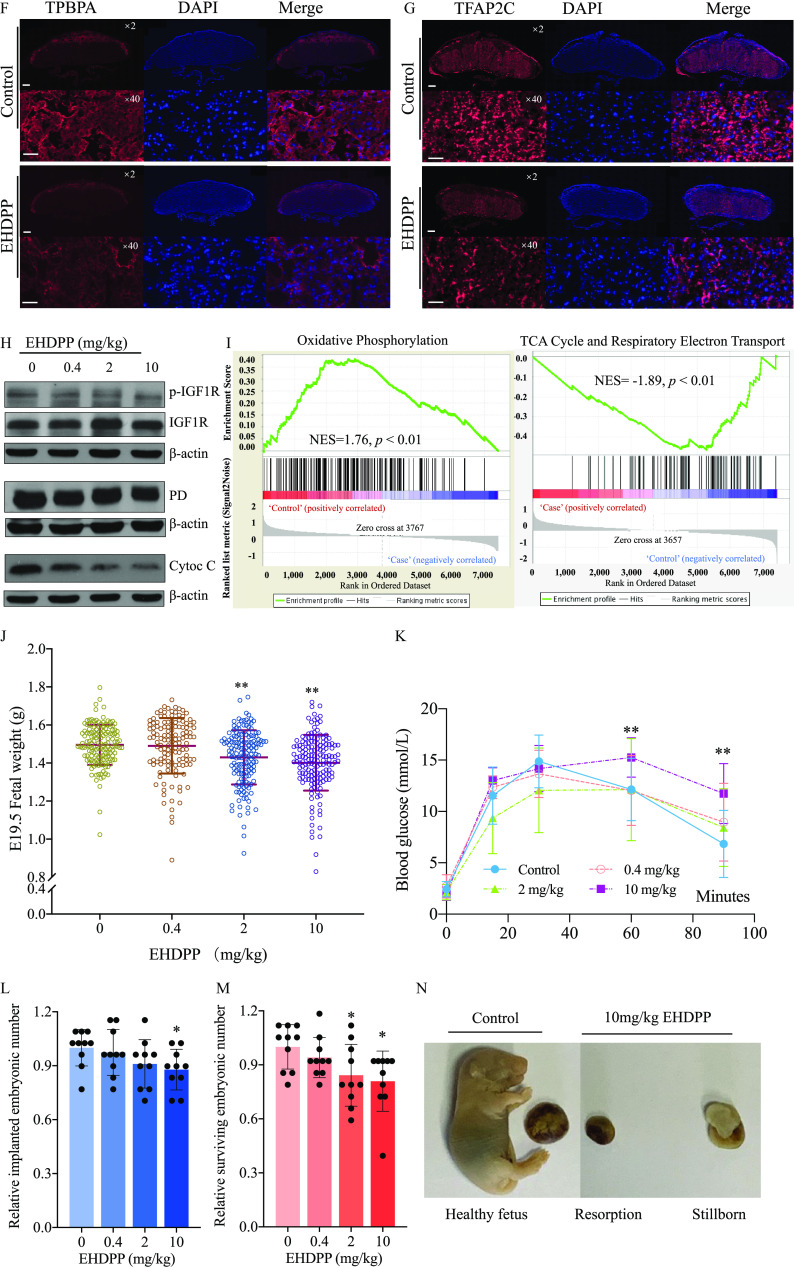
Figure 5A is a timeline titled Maternal 2-ethylhexyl-diphenyl phosphate exposure displays the following information: Day 0: 8 weeks female mice. Day 14: Fertilization. Day 21.5: Embryo 7.5 with Placenta, including Antigen K I-67 per Caudal-type homeobox 2. The Fetal outcomes include Implantation failure or Stillbirth or Fetal growth restriction. Day 33.5: Embryo 19.5 with Placenta, including trophoblast specific protein lowercase alpha or transcription factor activating protein 2 lowercase gamma or Heart and Neural Crest Derivatives Expressed 1. The fetal outcomes include Impaired glucose tolerance. Figure 5B is a schematic illustration of an embryo displaying Extra-embryonic ectoderm and Pluripotent epiblast. Figure 5C is a stained tissue having three columns, namely, Caudal-type homeobox 2, Antigen K I-67, and Merge, and two rows, namely, Control and 2-ethylhexyl-diphenyl phosphate. Figures 5D and 5E are bar graphs, plotting Caudal-type homeobox 2 of Embryo 7.5 mice, ranging from 0.0 to 1.4 in increments of 0.2 and Antigen K I-67, of Embryo 7.5 mice, ranging from 0.0 to 1.2 in increments of 0.3 (y-axis) across control and 2-ethylhexyl-diphenyl phosphate (x-axis). Figure 5F is a stained tissue having three columns, namely, Trophoblast specific protein lowercase alpha, 4′,6-diamidino-2-phenylindole, and Merge, and two rows, namely, control and 2-ethylhexyl-diphenyl phosphate. Figure 5G is a stained tissue having three columns, namely, transcription factor activating protein 2 lowercase gamma, 4′,6-diamidino-2-phenylindole, and Merge, and two rows, namely, control and 2-ethylhexyl-diphenyl phosphate. Figure 5H is a western blot displays 0, 0.4, 2, and 10 in 2-ethylhexyl-diphenyl phosphate (milligram per kilogram) as columns and phosphorylated-insulin growth factor 1 receptor, insulin growth factor 1 receptor, lowercase beta-actin, pyruvate dehydrogenase complex, lowercase beta actin, Cytochrome C, and lowercase beta actin as rows. Figure 5I is a set of two Gene Set Enrichment Analysis graphs titled Oxidative Phosphorylation and tricarboxylic acid Cycle and Respiratory Electron Transport, plotting Ranked list metric (Signal 2 Noise), ranging from negative 1 to 2 in unit increments and negative 2 to 1 in unit increments, and Enrichment Score, ranging from 0.00 to 0.40 in increments of 0.05 and negative 0.4 to 0.0 in increments of 0.1 (y-axis) across Rank in Ordered Dataset, ranging from 0 to 7000 in increments of 1000 (x-axis) for Enrichment profile, hits, and ranking metric scores, respectively. Figure 5J is a strip plot, plotting Embryo 19.5 fetal weight (gram), ranging from 0.0 to 0.8 in increments of 0.4 and 1.0 to 2.0 in increments of 0.2 (y-axis) across 2-ethylhexyl-diphenyl phosphate (milligram per kilogram), ranging from 0 to 0.4 in increments of 0.4, 0.4 to 2 in increments of 1.6, and 2 to 10 in increments of 8 (x-axis). Figure 5K is a line graph, plotting Blood glucose (millimole per liter), ranging from 0 to 20 in increments of 5 (y-axis) across minutes, ranging from 0 to 100 in increments of 20 (x-axis) for control, 0.4 milligram per kilogram, 2 milligrams per kilogram, and 10 milligrams per kilogram. Figures 5L and 5M are bar graphs, plotting Relative implanted embryonic number and Relative surviving embryonic number, ranging from 0.0 to 1.2 in increments of 0.3 (y-axis) across 2-ethylhexyl-diphenyl phosphate (milligram per kilogram), ranging from 0 to 0.4 in increments of 0.4, 0.4 to 2 in increments of 1.6, and 2 to 10 in increments of 8 (x-axis). Figure 5N is a set of two images. The first image depicts a healthy mice fetus under control. The second image depicts the resorption and stillborn mice under 10 milligrams per kilogram of 2-ethylhexyl-diphenyl phosphate.

Figure 5A is a timeline titled Maternal 2-ethylhexyl-diphenyl phosphate exposure displays the following information: Day 0: 8 weeks female mice. Day 14: Fertilization. Day 21.5: Embryo 7.5 with Placenta, including Antigen K I-67 per Caudal-type homeobox 2. The Fetal outcomes include Implantation failure or Stillbirth or Fetal growth restriction. Day 33.5: Embryo 19.5 with Placenta, including trophoblast specific protein lowercase alpha or transcription factor activating protein 2 lowercase gamma or Heart and Neural Crest Derivatives Expressed 1. The fetal outcomes include Impaired glucose tolerance. Figure 5B is a schematic illustration of an embryo displaying Extra-embryonic ectoderm and Pluripotent epiblast. Figure 5C is a stained tissue having three columns, namely, Caudal-type homeobox 2, Antigen K I-67, and Merge, and two rows, namely, Control and 2-ethylhexyl-diphenyl phosphate. Figures 5D and 5E are bar graphs, plotting Caudal-type homeobox 2 of Embryo 7.5 mice, ranging from 0.0 to 1.4 in increments of 0.2 and Antigen K I-67, of Embryo 7.5 mice, ranging from 0.0 to 1.2 in increments of 0.3 (y-axis) across control and 2-ethylhexyl-diphenyl phosphate (x-axis). Figure 5F is a stained tissue having three columns, namely, Trophoblast specific protein lowercase alpha, 4′,6-diamidino-2-phenylindole, and Merge, and two rows, namely, control and 2-ethylhexyl-diphenyl phosphate. Figure 5G is a stained tissue having three columns, namely, transcription factor activating protein 2 lowercase gamma, 4′,6-diamidino-2-phenylindole, and Merge, and two rows, namely, control and 2-ethylhexyl-diphenyl phosphate. Figure 5H is a western blot displays 0, 0.4, 2, and 10 in 2-ethylhexyl-diphenyl phosphate (milligram per kilogram) as columns and phosphorylated-insulin growth factor 1 receptor, insulin growth factor 1 receptor, lowercase beta-actin, pyruvate dehydrogenase complex, lowercase beta actin, Cytochrome C, and lowercase beta actin as rows. Figure 5I is a set of two Gene Set Enrichment Analysis graphs titled Oxidative Phosphorylation and tricarboxylic acid Cycle and Respiratory Electron Transport, plotting Ranked list metric (Signal 2 Noise), ranging from negative 1 to 2 in unit increments and negative 2 to 1 in unit increments, and Enrichment Score, ranging from 0.00 to 0.40 in increments of 0.05 and negative 0.4 to 0.0 in increments of 0.1 (y-axis) across Rank in Ordered Dataset, ranging from 0 to 7000 in increments of 1000 (x-axis) for Enrichment profile, hits, and ranking metric scores, respectively. Figure 5J is a strip plot, plotting Embryo 19.5 fetal weight (gram), ranging from 0.0 to 0.8 in increments of 0.4 and 1.0 to 2.0 in increments of 0.2 (y-axis) across 2-ethylhexyl-diphenyl phosphate (milligram per kilogram), ranging from 0 to 0.4 in increments of 0.4, 0.4 to 2 in increments of 1.6, and 2 to 10 in increments of 8 (x-axis). Figure 5K is a line graph, plotting Blood glucose (millimole per liter), ranging from 0 to 20 in increments of 5 (y-axis) across minutes, ranging from 0 to 100 in increments of 20 (x-axis) for control, 0.4 milligram per kilogram, 2 milligrams per kilogram, and 10 milligrams per kilogram. Figures 5L and 5M are bar graphs, plotting Relative implanted embryonic number and Relative surviving embryonic number, ranging from 0.0 to 1.2 in increments of 0.3 (y-axis) across 2-ethylhexyl-diphenyl phosphate (milligram per kilogram), ranging from 0 to 0.4 in increments of 0.4, 0.4 to 2 in increments of 1.6, and 2 to 10 in increments of 8 (x-axis). Figure 5N is a set of two images. The first image depicts a healthy mice fetus under control. The second image depicts the resorption and stillborn mice under 10 milligrams per kilogram of 2-ethylhexyl-diphenyl phosphate.

Effects of EHDPP on placental structure and pregnancy in female mice. (A) CD-1 female mice exposed to EHDPP; (B) Schematic of E7.5 embryo; (C) Cdx2 (green), Ki67, and DAPI (blue) in E7.5 in control and EHDPP (10mg/kg/d) exposure groups (n=5) (Scale bars, 20μm); (D) Relative intensity of Cdx2 (means±SDs) in control and EHDPP (10mg/kg/d) exposure groups; (E) Relative intensity of Ki67 (means±SDs) in control and EHDPP (10mg/kg/d) exposure groups; (F) TPBPA (red) and DAPI (blue) in E19.5 placentas in control and EHDPP (10mg/kg/d) exposure groups; (G) TFAP2C (red) and DAPI (blue) in E19.5 placentas in control and EHDPP (10mg/kg/d) exposure groups (n=5); (H) Protein levels of p-IGF1R (Y1135), IGF1R, PD, Cytochrome C and β-actin in E19.5 fetal placentas treated with EHDPP; (I) GSEA analysis between placentas of control and 10mg/kg EHDPP exposure group; (J) E19.5 fetal weight (means±SDs) after EHDPP exposure to pregnant mouse; (K) OGTT in 4-wk-old offspring after intrauterine EHDPP exposure (blood glucose concentrations; means±SDs); (L) Survived embryonic numbers (means±SDs) in control and EHDPP exposure groups; (M) Implanted embryonic numbers (means±SDs) in control and EHDPP exposure groups; (N) Resorption and stillborn after EHDPP exposure. Data in (D) and (E) and (L) and (M) are expressed relative to the levels in the control group, which were set to 1. (C–G), n=5; (H) and (I), n=3; (K), five female and five male offspring; (J), (L–N), n=10. Data were analyzed using an unpaired two-tailed Student’s t-test. Indicated values are significantly different from the control value. (F–G): Scale bars: 500μm in ×2 and 50μm in ×40. Numeric data in (D), (E), (J), (L) and (M) are listed in Table S14. Numeric data in (K) are listed in Table S15. Note: Cdx2, caudal-type homeobox 2; DAPI, 4′,6-diamidino-2-phenylindole; E7.5, late gastrulation stage embryos; E19.5, newborn mouse; EHDPP, 2-ethylhexyl-diphenyl phosphate; GSEA, gene set enrichment analysis; IGF1R, insulin-like growth factor 1 receptor; OGTT, oral glucose tolerance test; PD, pyruvate dehydrogenase complex; SD, standard deviation; TFAP2C, transcription factor AP-2γ; TPBPA, trophoblast-specific proteinα. *p<0.05 and **p<0.01.