Ions m/z detected in ESI-MS-MS analysis (negative mode) in samples of NAP degradationa.
| Compound | Structure | Formula | [M–H]− | Error (ppm) | mSigma | Abundance (%) | |
|---|---|---|---|---|---|---|---|
| 1 | 2-(3-(Hydroxymethyl)-4-(2-methoxyethyl)phenyl)propanoic acid |
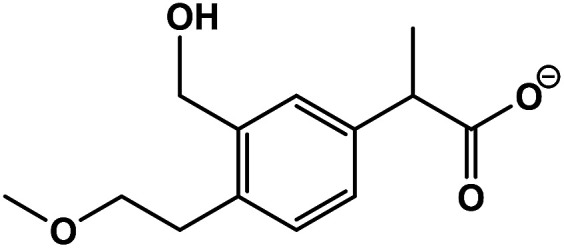
|
C13H18O4 | 237.1125 | 3.1 | 2.9 | 3.6 |
| 2 | 2-(4-(2-Mmethoxyethyl)-3-methylphenyl)propanoic acid |
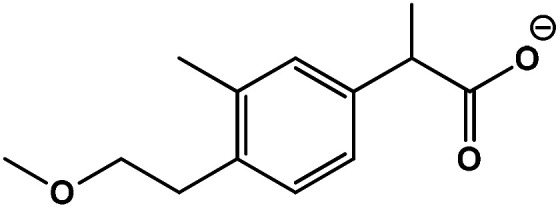
|
C13H18O4 | 221.1153 | 15.9 | 1.2 | 2.5 |
| 3 | 1-(6-Methoxynaphthalene-2-yl)ethylhydroperoxide |
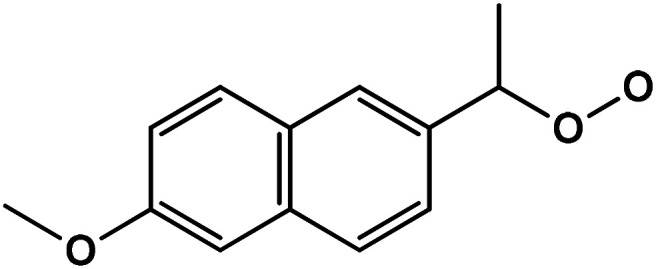
|
C13H14O3 | 217.0852 | 8.2 | 9.4 | 1.6 |
| 4 | 2-(4-(2-Hydroxyvinyl)phenyl)acetic acid |
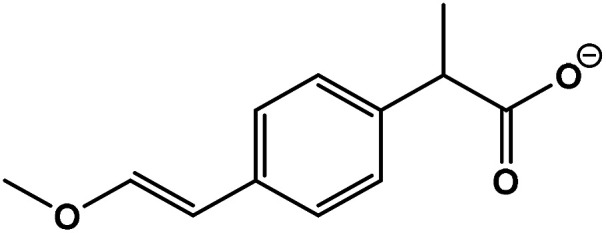
|
C12H14O3 | 205.0833 | −18.0 | 9.8 | 2.0 |
| 5 | 2-(4-(2-Hydroxyvinyl)phenyl)acetic acid |
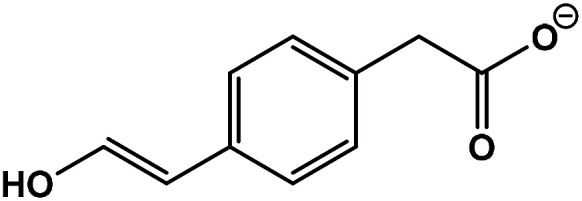
|
C10H10O3 | 177.0554 | 1.7 | 12.4 | 3.2 |
| 6 | 2-(p-Tolyl)acetic acid |
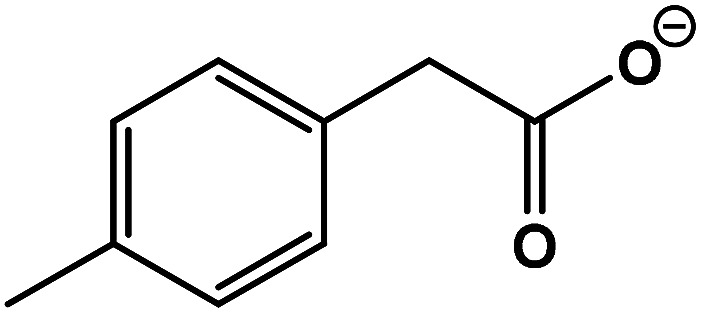
|
C9H10O2 | 149.0592 | −10.8 | 8.5 | 1.8 |
Error [ppm]: absolute value of the deviation between measured mass and theoretical mass of the selected peak in [ppm]. mSigma: combined value for the standard deviation of the masses and intensities for all peaks, given in [milliSigma].
