. 2019 May 15;9(26):15073–15083. doi: 10.1039/c9ra02142f

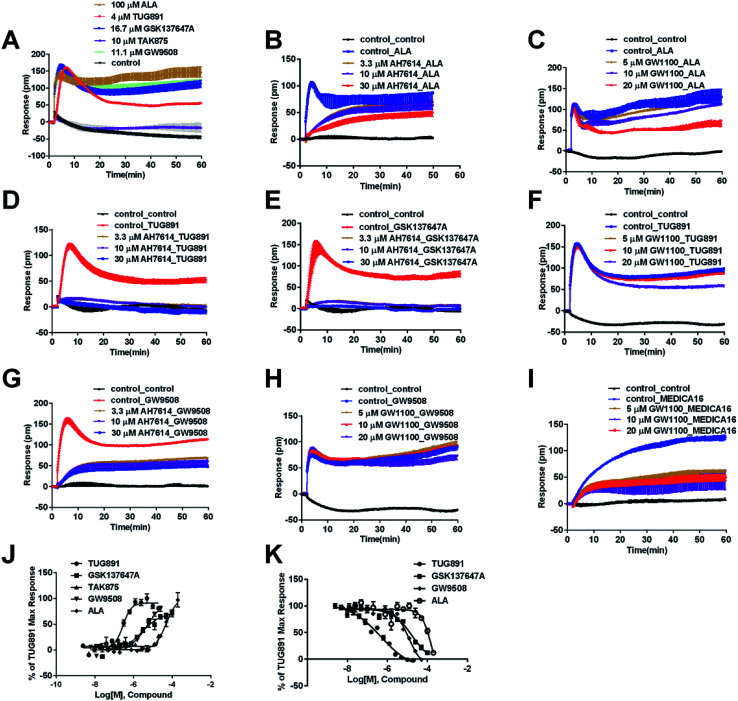
Fig. 4. DMR response of ligands in HT29 cells. (A) Real-time DMR response of 100 μM ALA, 4 μM TUG891, 16.7 μM GSK137647A, 10 μM TAK875 and 11.1 μM GW9508. (B) Real-time DMR of 60 μM ALA after HT29 cells pretreated with AH7614 at indicated concentrations. (C) Real-time DMR of 60 μM ALA after HT29 cells pretreated with GW1100 at indicated concentrations. (D) Real-time DMR of 2 μM TUG891 after HT29 cells pretreated with AH7614 at indicated concentrations. (E) Real-time DMR of 16 μM GSK137647A after HT29 cells pretreated with AH7614 at indicated concentrations. (F) Real-time DMR of 2 μM TUG891 after HT29 cells pretreated with GW1100 at indicated concentrations. (G) Real-time DMR of 16 μM GW9508 after HT29 cells pretreated with AH7614 at indicated concentrations. (H) Real-time DMR of 16 μM GW9508 after HT29 cells pretreated with GW1100 at indicated concentrations. (I) Real-time DMR of 50 μM MEDICA16 after HT29 cells pretreated with GW1100 at indicated concentrations. (J) Amplitudes as a function of each agonist doses. (K) The concentration-dependent inhibition of the 5 μM TUG891 DMR by TUG891, GSK137647A, GW9508 and ALA. All data represent mean ± s.d. from three independent measurements, each in duplicate (n = 6).

Fig. 4