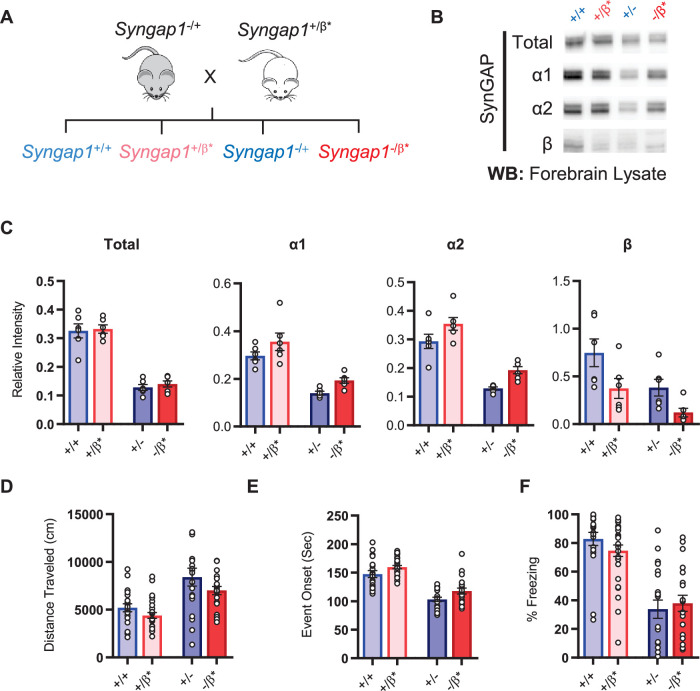
Figure 4. Characterization of offspring derived from Syngap1+/- and Syngap1β*/+ cross-breeding.
(A) Breeding scheme for offspring genotypes for Syngap1 +/-and Syngap1+/β* lines. (B) Representative western blots showing expression levels of total SynGAP and individual isoforms at PND7 for all genotypes. (C) Quantification of B. Two-way ANOVA with Tukey’s multiple comparison test. Total: (-) allele F(1, 20) = 146.3, p < 0.0001; β* allele F(1, 20) = 0.3344, p = 0.5696. Allelic Interaction F(1, 20) = 0.03191, p = 0.8600. α1: (-) allele F(1, 20) = 56.01, p < 0.0001; β* allele F(1, 20) = 7.009, p = 0.0155; Allelic Interaction F(1, 20) = 0.02397, p = 0.8785. α2: (-) allele F(1, 20) = 81.79, p < 0.0001; β* allele F(1, 20) = 11.92, p = 0.0025; Allelic Interaction F(1, 20) = 0.0044, p = 0.9479. β: (-) allele F(1, 20) = 9.149, p = 0.0067; β* allele F(1, 20) = 9.676, p = 0.0055; Allelic Interaction F(1, 20) = 0.3027, p = 0.5883. (D) Quantification of total distance traveled in open field test. Two-way ANOVA with Tukey’s multiple comparison test. (-) allele F(1, 86) = 28.85, p < 0.0001; β* allele F(1, 86) = 4.132, p = 0.0452; Allelic Interaction F(1, 86) = 0.2951, p = 0.5884 (E) Latency of event onset was measured as the time taken to 1st clonus (seizure onset). Two-way ANOVA with Tukey’s multiple comparison test. (-) allele F(1, 82) = 91.71, p < 0.0001; β* allele F(1, 82) = 8.967, p = 0.0036; Allelic Interaction F(1, 82) = 0.07333, p = 0.7872 (F) Percent freezing in remote contextual fear memory paradigm. Two-way ANOVA with Tukey’s multiple comparison test. (-) allele F(1, 86) = 69.37, p < 0.0001; β* allele F(1, 86) = 0.1544, p = 0.6953; Allelic Interaction F(1, 86) = 1.392, p = 0.2414.


