. 2022 Apr 8;11:e75707. doi: 10.7554/eLife.75707

Figure 5. Validation of SynGAP PDZ binding motif (PBM) mutations and construction of the Syngap1PBM mouse line.

(A) Schematic diagram for exon map and alternative use of Exon21 in Syngap1 gene. Exon21b encodes for α1 isoform. Exon 21 a encodes for α2 isoform. Point mutations indicated in red alter exon 21b coding sequence without influencing exon21a open reading frame. (B) Schematics of SynGAPα1 and PSD95 domain structure and the location of point mutations. (C) Illustrations of constructs expressed in HeLa cells to study PDZ-dependent interaction between SynGAP and PSD95. EGFP-CC constructs are homologous to SynGAPα1 C-terminus. (D) Co-localization of EGFP-CCα1 and PSD95-tRFP in HeLa Cells. Representative images showing subcellular localizations of WT or PDZ-binding mutant (PBM) EGFP-CCα1 and PSD95-tRFP in HeLa cells when expressed individually or together. (E) Quantification of (D). Nuclear localization is calculated as the ratio of EGFP signal colocalized with DAPI vs total EGFP intensity in within an individual cell. ANOVA with Tukey’s multiple comparisons test, F(3, 96) = 531.4. p < 0.0001 (F) Schematics of the targeting strategy. The targeting vector was spanning Exon20 and 21. The vector included point mutations in Exon21, a neomycin resistance selection cassette flanked by Cre recombination sites and diphtheria toxin selection cassette (DTA). (G) Southern blot analysis showing the genomic DNA of the tested heterozygous mice compared to C57BL/6 J wild-type DNA. The AflII digested DNAs were blotted on nylon membrane and hybridized with external 5' probe spanning exon19. (H) PCR based genotyping strategy. Primers flanking leftover LoxP site yields 61 bp product in WT and 120 bp product in mutated allele. (I) Representative western blots showing expression levels of total SynGAP and individual isoforms in forebrain lysates. (J) Quantification of I. Relative intensity of bands normalized to total protein signal. Only α1 signal is significantly changed. ANOVA with Tukey’s multiple comparisons test, F(2, 14) = 24.86, n = 5.

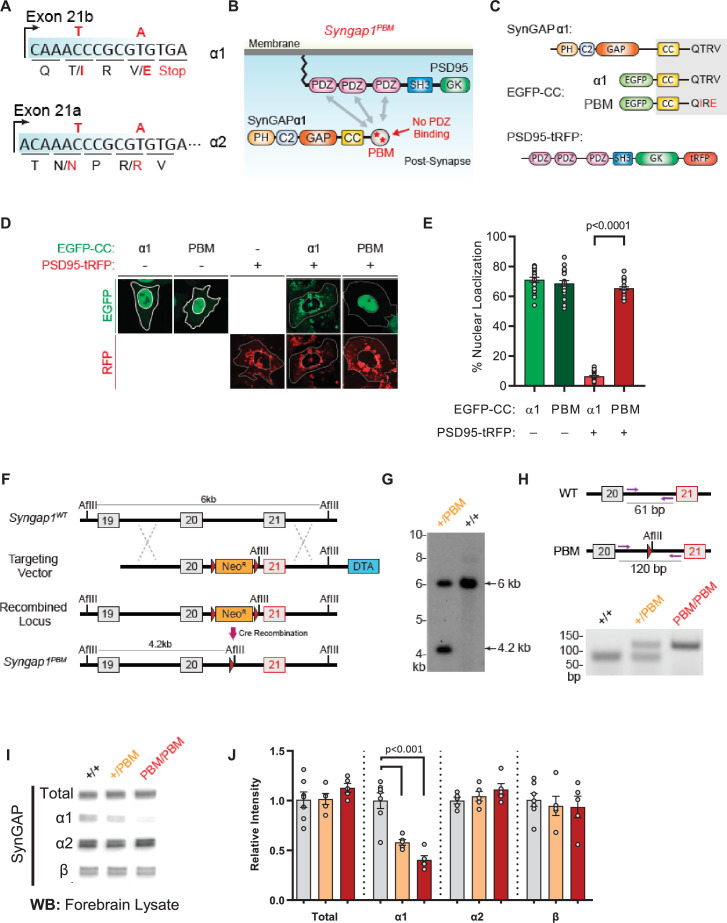
Figure 5—source data 1. Representative blots.

Figure 5.

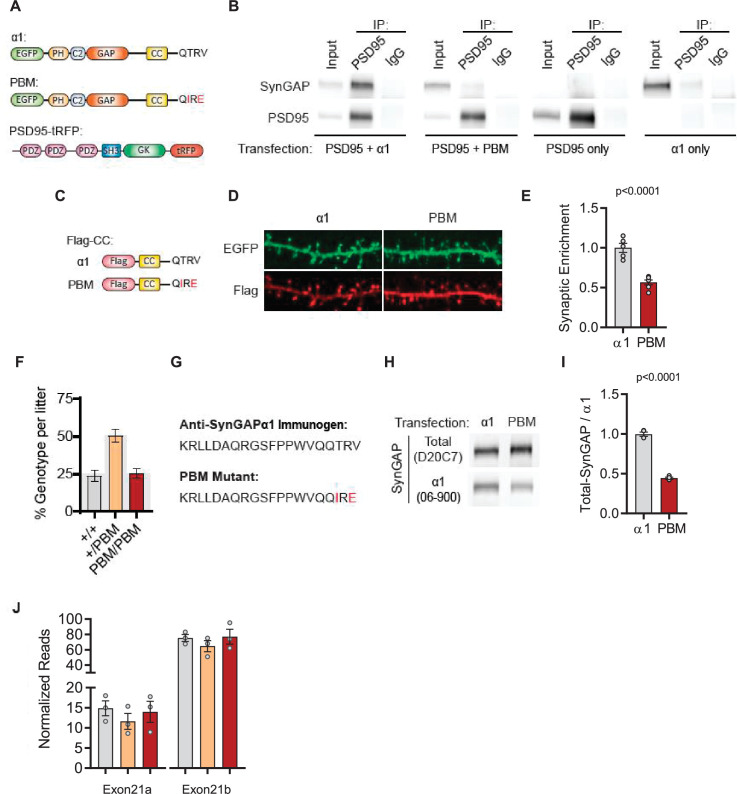
Figure 5—figure supplement 1. Determining impact of proposed PBM coding mutations on SynGAP protein.

Figure 5—figure supplement 1.

(A) Illustrations of constructs expressed in H293T cells to study PDZ-dependent interaction between SynGAP and PSD95. (B) Coimmunoprecipitation of PSD-95 and SynGAPα1 from transfected H293T cells. PSD95-tRFP coprecipitates with SynGAPα1. This Interaction was disrupted by PBM mutations. (C) Illustrations of Flag-tagged SynGAP C-terminal constructs expressed in primary cortical neurons. (D) Subcellular localization of wild-type or PBM mutated Flag-CCα1 in primary forebrain neurons. Note that Flag-CC α1 is heavily enriched in dendritic spines compared to Flag-CC PBM. Height of the image is 5 µm. (E) Quantification of synaptic enrichment of Flag-CC constructs. Enrichment in dendritic spines were calculated as the ratio of Flag signal in spines vs dendrites over ratio of EGFP signal in spines vs dendrites. Unpaired t-test, t(9)=6.982 p < 0.0001. Introduced point mutations impeded the enrichment of Flag-tagged SynGAPα1 C-terminal construct in primary forebrain neurons. (F) Genotype frequencies observed from 15 litters following heterozygous crosses. Expected mendelian ratio is highlighted with gray. (G) Antigen for α1-specific antibody in comparison to PBM mutant C-tail. (H) Reduced antigenicity of α1 antibody against PBM mutant C-terminus. H293T cells were transfected with either wild-type or PDZ-binding mutant form of EGFP-SynGAPα1. Lysates were probed for both Pan-SynGAP (D20C7) and α1-specific (06–800) antibody. Relative reduction in α1 to Pan-SynGAP signal demonstrates ~50% reduction in antigenicity. (I) Quantification of (D) Unpaired t-test. t(6)=19.16, n = 4, p < 0.0001. (J) SynGAP α1 mRNA levels in forebrain transcriptome. Normalized reads of Exon21b (specific to α1) were shown in linear scale. ANOVA F(2,6)=0.3009, n = 3, p = 0.7507. No significant changes were found across genotypes indicating that point mutations do not influence the mRNA expression levels.
Figure 5—figure supplement 1—source data 1. Representative blots.