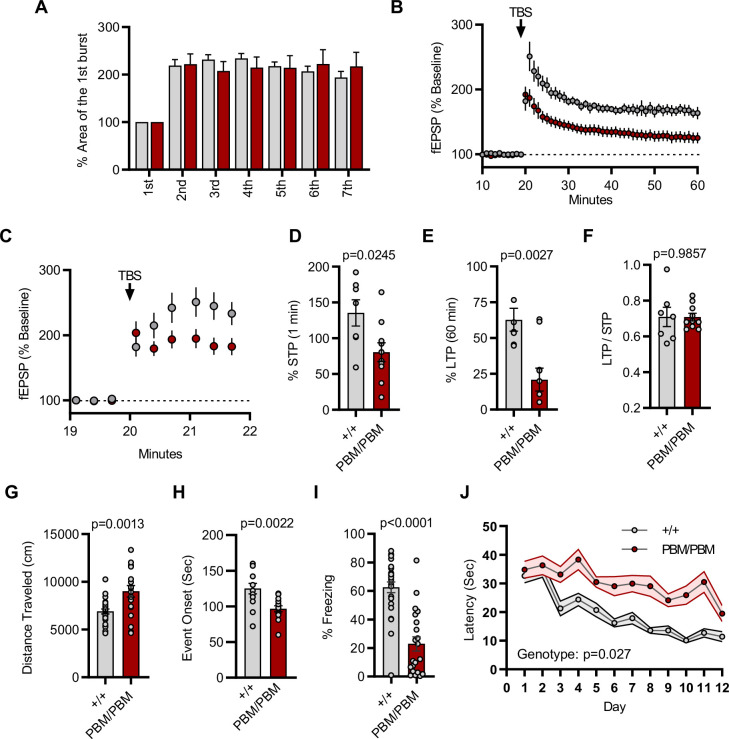
Figure 8. Plasticity and behavior deficits in the Syngap1PBM mouse line.
(A) Facilitation of burst responses was calculated by expressing the area of the composite fEPSP corresponding to the 2nd theta burst within each train as a fraction of the 1st burst response. No statistically significant difference was found between genotypes (wildtypes are shown in gray and PBM/PBM are in red). (B) Magnitude of long-term potentiation (LTP) following delivery of a single train of five theta bursts. The slope of the fEPSP was normalized to the mean value for a 20 min baseline period; shown are group means and standard errors. (C) Percent fEPSP during and immediately after the LTP induction. Note that homozygous mutants reach to peak potential immediately following TBS. (D) Bar graph shows % potentiation in 1 min after stimulus. t(15)=2.499, p = 0.0245. (E) Bar graph shows % potentiation in 60 min after stimulus. t(15)=3.594, p = 0.0027. (F) LTP to STP ratio of individual slices. Note that the level of LTP is proportional to the degree of acute potentiation (1 min after stimulus). t(15)=0.01818, p = 0.9857. (G) Quantification of total distance traveled in OFT. t(45)=3.427, p = 0.0013. (H) Seizure threshold was measured as the time taken to reach three separate events of 1st clonus (event onset) during the procedure. Unpaired t-test t(25)=3.420 p = 0.0022. (I) Percent freezing in remote contextual fear memory paradigm. % Freezing: t(45)=6.463, p < 0.0001. (J) Plots demonstrating latency to find platform across days in Morris Water Maze training session. Statistical significance was determined by using linear mixed model for repeated measures. n = 14, +/+ vs PBM/PBM, p = 0.027.

