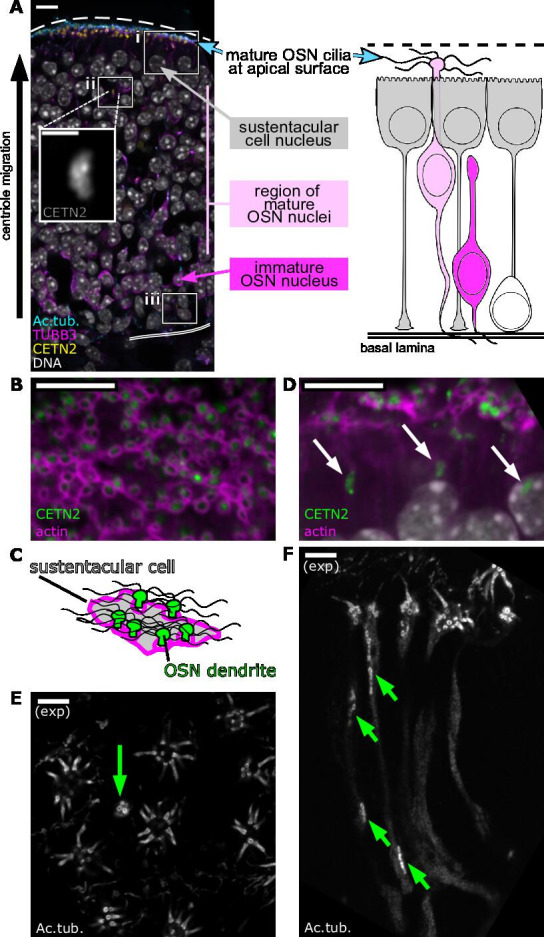
Figure 1. Centrioles in olfactory sensory neurons (OSNs) migrate tens of micrometers to the apical surface.
(A) Overview of the olfactory epithelium. Single-plane fluorescence image of a side view of the olfactory epithelium (left), corresponding to a schematic of cell types in the olfactory epithelium (right). Yellow: eGFP-centrin2; cyan: staining for acetylated tubulin, strongly marking olfactory cilia and, faintly, neuronal microtubules; magenta: staining for β-tubulin III, marking neuronal microtubules; white: DAPI, marking DNA. The apical surface is oriented at the top of this image and all subsequent side-view images. Dashed line: apical surface; double solid line: basal lamina. Boxes show the relative positions of critical stages of OSN differentiation: (i) the subapical compartment of the olfactory epithelium, defined as the space between the bottom of the sustentacular cell nuclei and the apical surface with olfactory cilia. (ii and inset) A group of centrioles migrating through the middle of the olfactory epithelium, below the sustentacular cell nuclei. (iii) A progenitor cell near the basal lamina. Scale bar = 10 μm. Inset scale bar = 2 μm. (B) Mature olfactory sensory neurons. Single-plane, en face fluorescence image of the apical surface of the olfactory epithelium. Green: eGFP-centrin2; magenta: dye-conjugated phalloidin, marking an enrichment of F-actin at the apical borders of sustentacular cells. Scale bar = 10 μm. (C) Schematic of (B) depicting a sustentacular cell wrapping around the dendrites of nearby OSNs. Green: OSN dendrite; gray: sustentacular cell cytoplasm; magenta: F-actin; wavy black lines: multiple OSN cilia. (D) Centriole migration in the olfactory epithelium. Single-plane fluorescence image of a side view of the subapical compartment of the olfactory epithelium. Green: eGFP-centrin2; magenta: dye-conjugated phalloidin; arrows: groups of migrating centrioles. Scale bar = 10 μm. (E) Mature olfactory sensory neurons, as imaged by expansion microscopy. Single-plane fluorescence image of the en face apical surface. White: staining for acetylated tubulin, marking centrioles, cilia, and, faintly, neuronal microtubules. Multiple cilia can be seen protruding from mature OSNs. A green arrow marks a dendrite with a group of migrating centrioles arriving at the apical tip. Scale bar = 2 μm. (F) Centriole migration, as imaged by expansion microscopy. Single-plane fluorescence image of a side view of the subapical compartment. White: staining for acetylated tubulin, marking centrioles, cilia, and, faintly, neuronal microtubules. Cilia can be seen at the apical surface, and green arrows mark groups of migrating centrioles. Scale bar = 2 μm.


