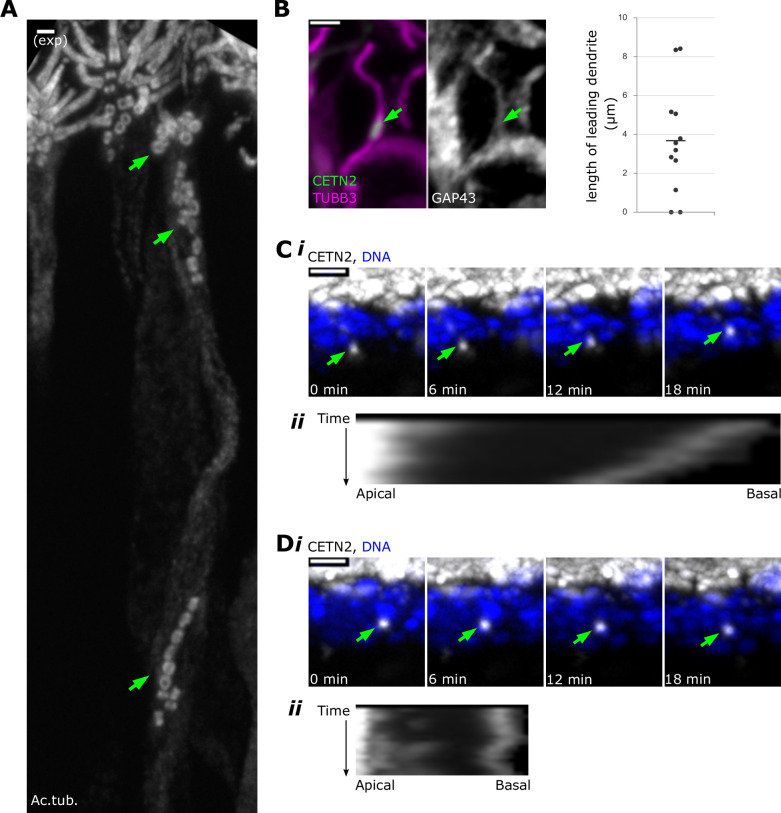
Figure 2. Centrioles migrate in multiple groups during dendrite elongation.
(A) Within a single dendrite, centrioles migrate in multiple groups. Expansion microscopy – side view of expanded olfactory epithelium. In all side-view images, apical is oriented toward the top of the image. White: staining for acetylated tubulin. Maximum z-projection of confocal stack. Mature olfactory sensory neurons (OSNs) have multiple cilia, which are visible at the apical surface. Green arrows: groups of centrioles migrating separately within the dendrite of a single OSN. Scale bar = 2 μm. (B) Centriole migration occurs concomitantly with dendrite elongation. Fluorescence image of a side view of the olfactory epithelium, maximum z-projection of confocal stack. In the leftmost image, magenta: staining for β-tubulin III; green: eGFP-centrin2. Middle image: staining for GAP43 in the same cell; arrows: a group of migrating centrioles. Scale bar = 2 μm. Rightmost image: a plot of lengths reflecting the distance from the centriole group to the end of the dendrite. (C) A centriole group migrates toward the apical surface. (i) Live time-lapse imaging of olfactory epithelium. Maximum x-projection image, showing a side view. White: eGFP-centrin2; blue: Hoechst, marking DNA in the most apical layer of nuclei, which are mostly sustentacular cells; green arrows: a group of centrioles moving toward the apical surface at 0.18 μm/min (fastest rate of all observed groups). See Figure 2—source data 1 for migration rates. See Figure 2—video 1 for original video. (ii) Kymograph illustrating migration of the centriole group. Apical and basal direction labels indicate orientation of the sample in the kymograph. (D) A centriole group with no net movement. (i) Live time-lapse imaging of olfactory epithelium, highlighting a different centriole group from the same acquisition as (C). Maximum x-projection image, showing a side view. White: eGFP-centrin2; blue: Hoechst; green arrows: a group of centrioles that have no net movement. See Figure 2—source data 1 for migration rates. See Figure 2—video 2 for original video. (ii) Kymograph illustrating a lack of total migration of the centriole group. Apical and basal direction labels indicate orientation of the sample in the kymograph.

