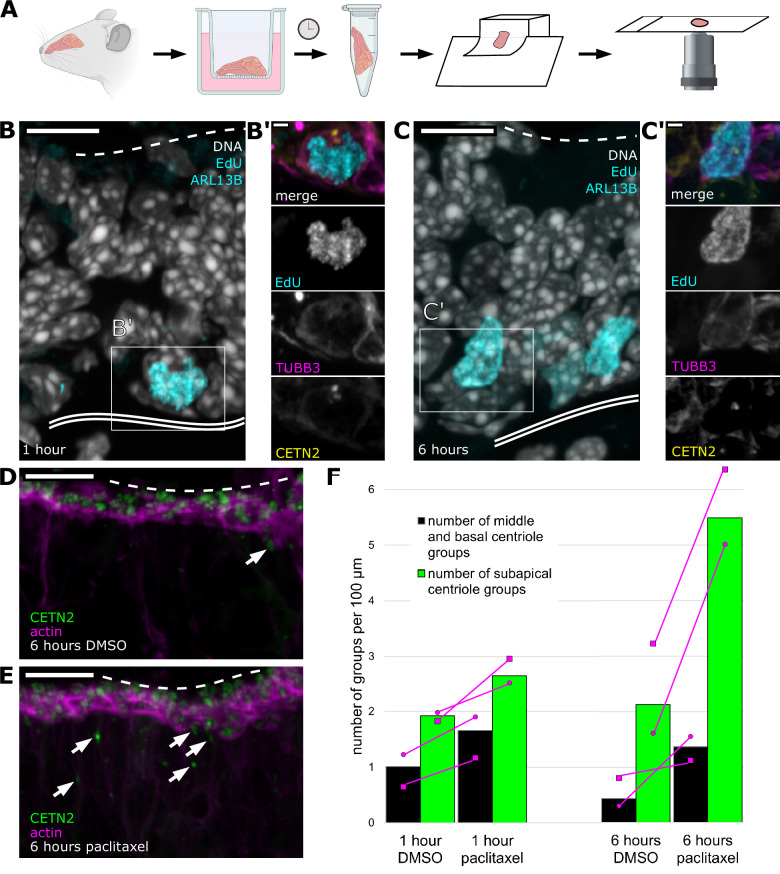
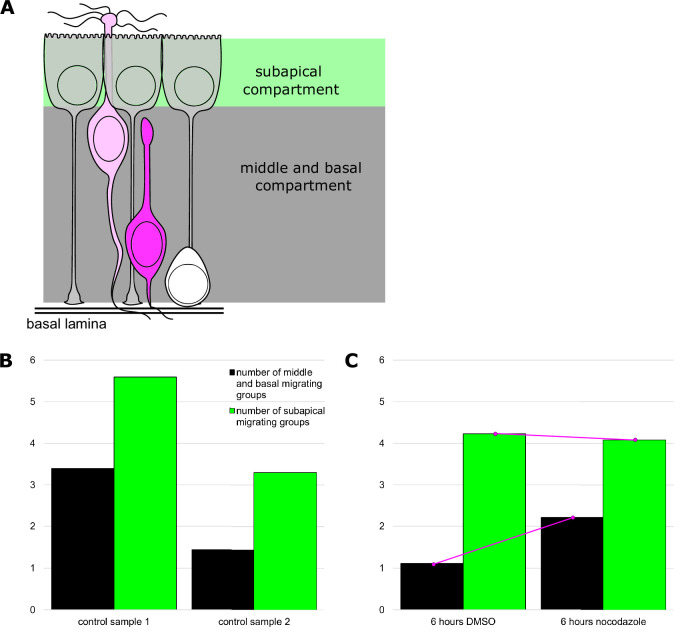
Figure 5. Centriole progression toward the apical surface can be altered by stabilizing microtubules.
(A) Schematic: workflow from sample collection through imaging of olfactory epithelium explants. Septal olfactory epithelium was taken from adult mice expressing eGFP-centrin2 and Arl13b-mCherry and plated on transwell filters with an air-liquid interface. After 1 or 6 hr, samples were fixed and processed for sectioning. Stained sections were analyzed by confocal microscopy. Figure created with BioRender.com. (B) Progenitor cells synthesize DNA by 1 hr ex vivo. Fluorescence image of an olfactory epithelium explant grown in EdU for 1 hr, maximum intensity projection. Gray: DAPI, marking all nuclei; cyan: EdU, conjugated to dye after fixation, marks cells that synthesized DNA ex vivo; dashed line: the apical surface; double solid line: basal lamina; box: location of the inset (B′). Scale bar = 10 μm. (B′) Inset from (B) showing a progenitor cell positive for EdU. Magenta: staining for β-tubulin III, showing that the cell is neuronally fated; yellow: eGFP-centrin 2, showing signal consistent with centriole amplification; cyan: EdU. Scale bar = 2 μm. (C) More cells synthesize DNA by 6 hr ex vivo. Fluorescence image of an olfactory epithelium explant grown in EdU for 6 hr, maximum intensity projection. Tissue was taken from the same animal as that shown in (B). Gray: DAPI, marking all nuclei; cyan: EdU, conjugated to dye after fixation, shows an increased number of cells that have synthesized DNA ex vivo, compared to 1 hr treatment. Box: location of the inset (C′). Scale bar = 10 μm. (C′) Inset from (C) showing a progenitor cell positive for EdU. Magenta: staining for β-tubulin III, showing that the cell is neuronally fated; yellow: eGFP-centrin 2 shows signal consistent with centriole amplification; cyan: EdU. Scale bar = 2 μm. (D) Control image of centriole group position in explants treated with DMSO for 6 hr. Single-plane fluorescence image. Green: eGFP-centrin2; magenta: dye-conjugated phalloidin; dashed line: apical surface; arrows: migrating centriole groups. Scale bar = 10 μm. (E) Centriole group position in explants treated with paclitaxel for 6 hr. Single-plane fluorescence image. Tissue was taken from the same animal as that shown in (D). Green: eGFP-centrin 2; magenta: dye-conjugated phalloidin; arrows: migrating centriole groups. Compared to (D), many centrioles are found below the apical surface. Dashed line: apical surface. Scale bar = 10 μm. (F) Bar plot summarizing centriole group position in explants grown for 1 or 6 hr in the presence of DMSO or paclitaxel. Green bars: migrating centriole groups in the subapical compartment of the epithelium (apical surface through sustentacular cell nuclei); black bars: centriole groups in the middle and basal regions of the epithelium (between sustentacular cell nuclei and basal lamina); magenta circles: normalized number of groups for the female sample; magenta squares: normalized number of groups for the male sample. Magenta lines connect paired samples. Counts were normalized to the lateral length of the basal lamina. Length of epithelium scored for each time point: 1 hr DMSO = 988.17 μm, 1 hr paclitaxel = 905.37 μm, 6 hr DMSO = 1126.44 μm, 6 hr paclitaxel = 1019.76 μm. Number of centriole groups counted: 1 hr DMSO = 29, 1 hr paclitaxel = 39, 6 hr DMSO = 29, 6 hr paclitaxel = 70. N = 2 animals. See Figure 5—source data 1 for values.


