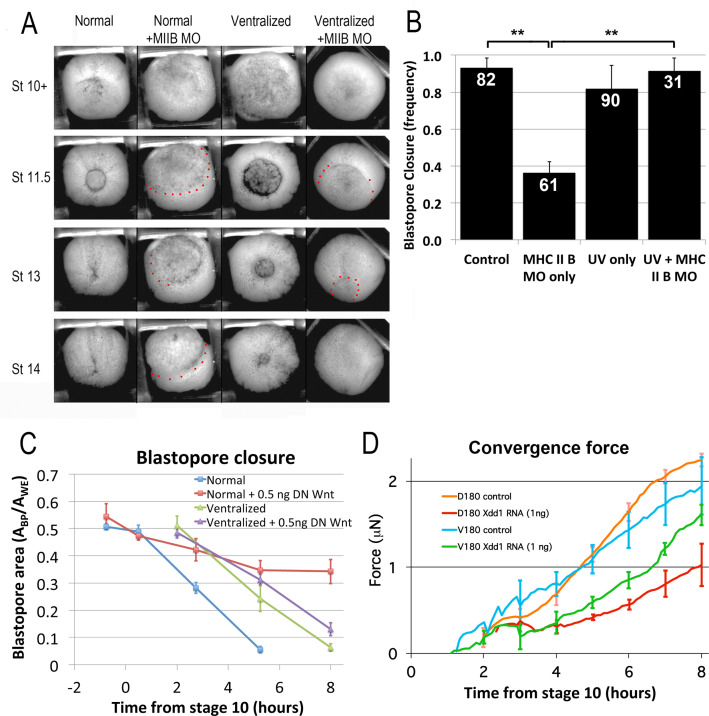
Figure 7. CT and CE depend on different molecular pathways.
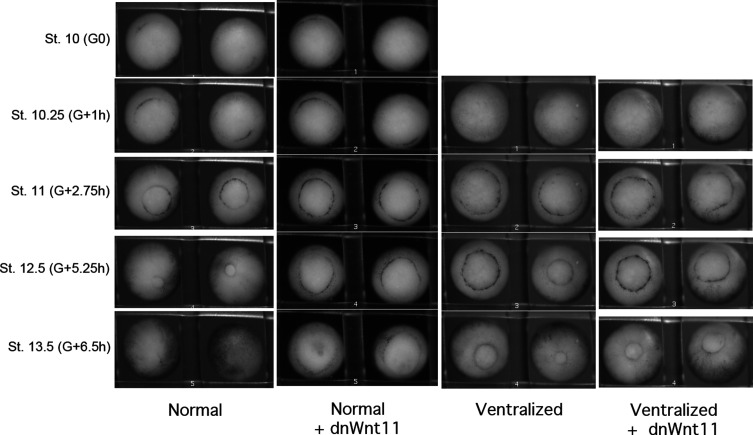
(A) Representative stills of time lapse movies (Video 22*) comparing blastopore closure in normal and ventralized embryos, un-injected or injected with an MHC IIB morpholino. The region just outside the blastopore or forming blastopore are indicated by red dots in cases where it is difficult to see. (B) Frequency of blastopore closure by Stage 20 (G + 13 h effective success of blastopore closure) was scored for embryos from 4 different clutches of embryos (n’s indicated on chart); ** = p < 0.01. Comparison of the extent of blastopore closure over time in normal and ventralized embryos, either un-injected or injected with 0.5 ng dnWnt11 RNA (C; see for example Figure 7—figure supplement 1 and Video 23*), based on the projected area of the blastopore, Abp, divided by the projected area of the whole embryo, Awe, measured from time lapse movies (n = 4 embryos for each treatment). Force measurements (Shook et al., 2018) of D180 or V180 explants made from embryos, either un-injected or injected with 1 ng Xdd1 RNA (D; n’s = 3–4 explants per treatment). Errors bars in all cases = SEM.


