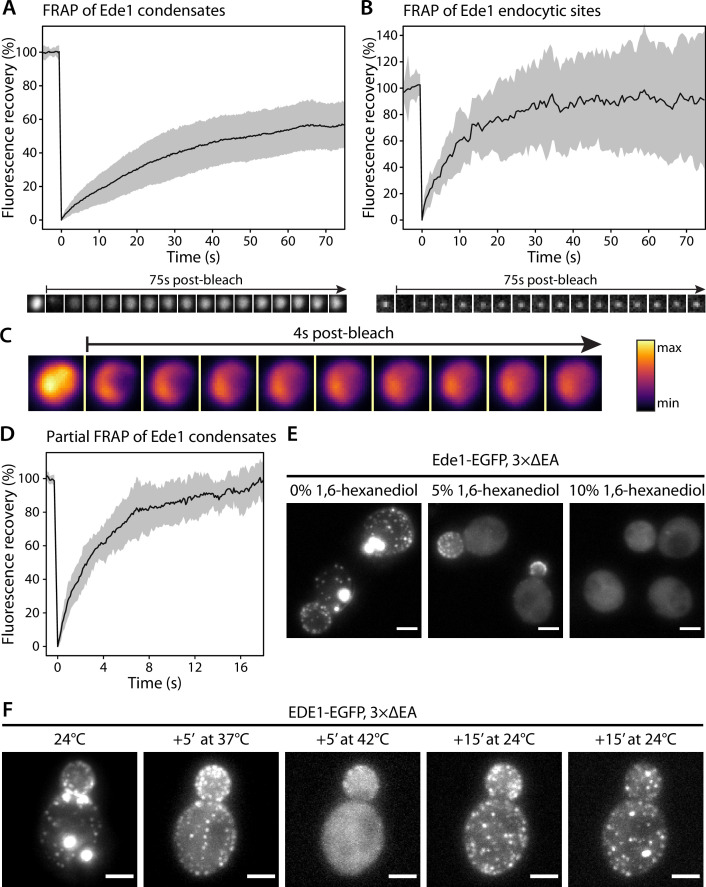
Figure 2. Ede1 structures exchange molecules with the cytoplasm and respond to temperature changes.
(A, B) Fluorescence recovery after photobleaching (FRAP) of Ede1-EGFP condensates in 3×ΔEA cells (A) and endocytic sites in normal cells (B). Plots show mean fluorescence recovery ± SD; n = 36 across four independent experiments (panel A) and n = 14 across three independent experiments (panel B). Representative time series are shown below each plot. Each frame is 1 μm × 1 μm. (C) Time series of a partial bleaching of a condensate in a cell overexpressing EGFP-Ede1. A perceptually uniform color lookup table has been applied to highlight the changes in intensity. Each frame is 1.5 μm × 1.5 μm.(D) Average fluorescence recovery (n = 14) after partial bleaching of condensates in cells overexpressing EGFP-Ede1, as in panel (C). (E) Representative cells after 5-min treatment with indicated concentrations of 1,6-hexanediol. Maximum Z-projections. (F) Ede1-EGFP was imaged in 3×ΔEA cells at different temperatures. Cells were grown and imaged at 24°C. The temperature was raised to 37 and 42°C and returned to 24°C for the indicated amounts of time. Maximum Z-projections. All scale bars: 2 μm.

