. 2022 Apr 12;11:e72865. doi: 10.7554/eLife.72865

Figure 6. Ede1 features necessary for phase separation are also crucial for its function.

(A) Representative cells expressing full-length Ede1 and three internal Ede1 deletion mutants: Ede1ΔPQ (Δ366-590), Ede1ΔCC (Δ591-900), and Ede1ΔPQCC (Δ366-900) tagged with EGFP. (B) Representative cells expressing Sla1-EGFP and indicated Ede1 mutants. (C, D) Sla1 patch density and lifetime in Ede1 mutants. Large points represent mean measurements from independently repeated datasets. Central line and whiskers denote the mean ± SD calculated from dataset averages. Gray points show individual observations. Letters denote pairwise comparisons based on Tukey-Kramer test; groups which do not share any letters are significantly different at α = 0.05. Scale bars: 2 μm.

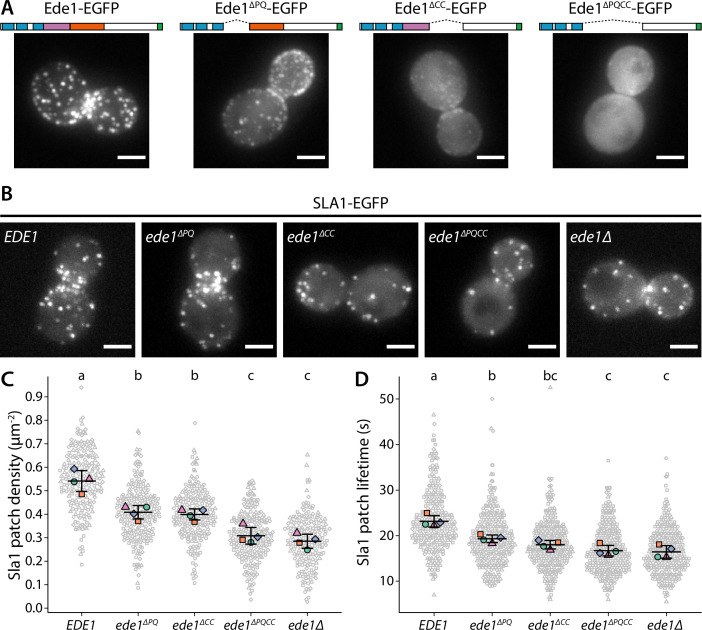
Figure 6—source data 1. Source data, code, and statistical details (panel C).
Figure 6—source data 2. Source data, code, and statistical details (panel D).

Figure 6.

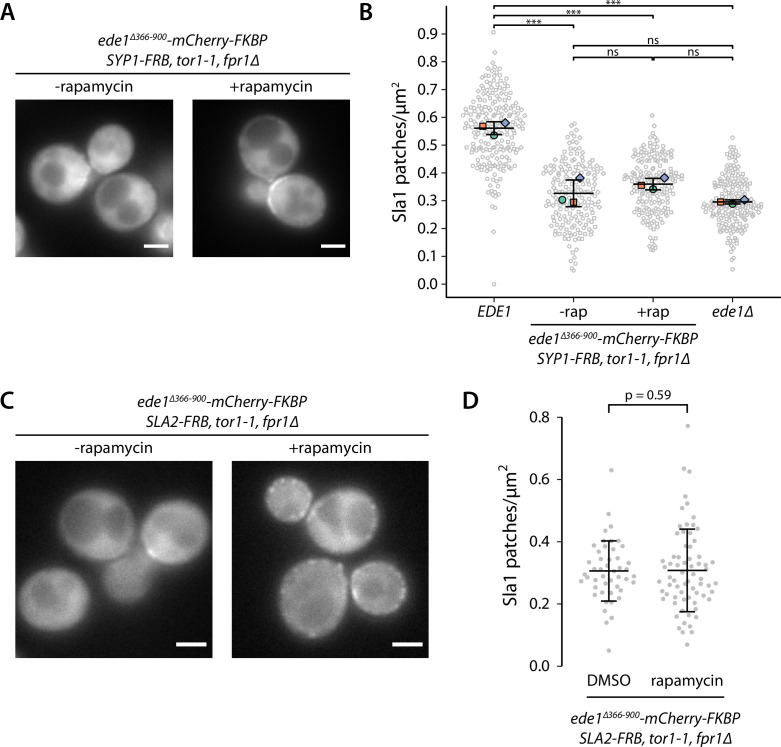
Figure 6—figure supplement 1. Recruitment of Ede1ΔPQCC to other proteins cannot rescue the endocytic defect.

Figure 6—figure supplement 1.

Ede1ΔPQCC-mCherry-FKBP was recruited to Syp1-FRB or Sla2-FRB by addition of 10 μg ml−1 of rapamycin to the growth medium. (A) Ede1ΔPQCC-mCherry-FKBP signal in cells coexpressing Syp1-FRB and Sla1-EGFP. (B) Density of Sla1-EGFP patches in cells expressing wild-type Ede1, Ede1ΔPQCC-mCherry-FKBP, and Syp1-FRB cultured with or without rapamycin, or no Ede1. Large points: mean measurements from independently repeated datasets. Central line and whiskers: mean ± SD calculated from dataset averages. Gray points: individual cells from all datasets. Statistical significance of pairwise comparisons was determined by Tukey-Kramer test; n.s., not significant; ***, p<0.001. (C) Ede1ΔPQCC-mCherry-FKBP signal in cells coexpressing Sla2-FRB and Sla1-EGFP. (D) Density of Sla1-EGFP patches in the same cells cultured with or without rapamycin. P-value from Welch’s t-test. Scale bars: 2 μm.