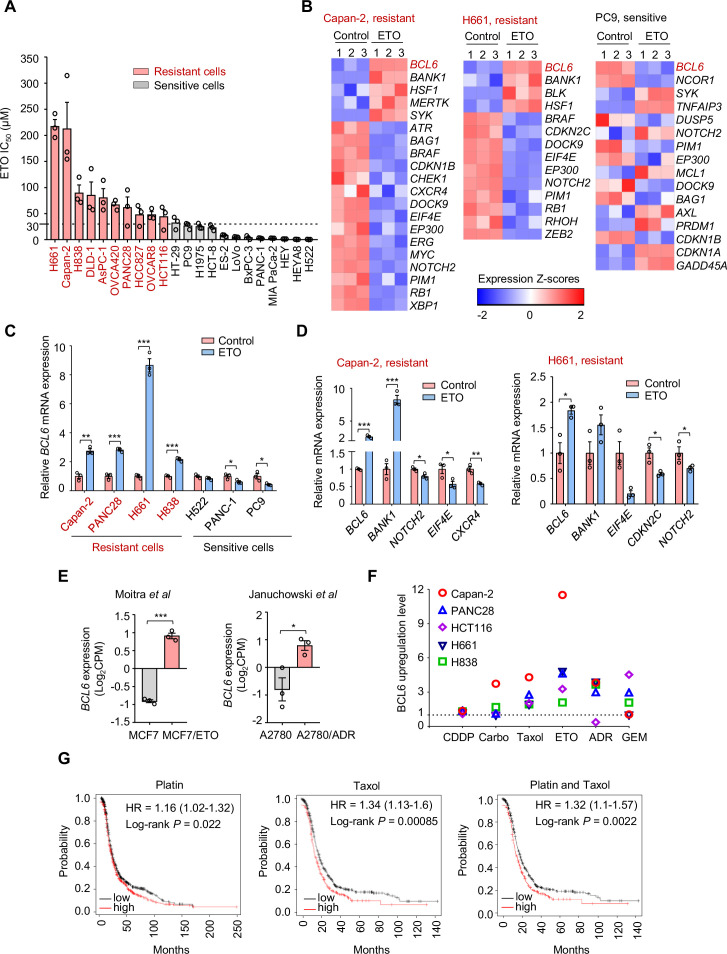
Figure 1. Genotoxic agents promote B cell lymphoma 6 (BCL6) expression.
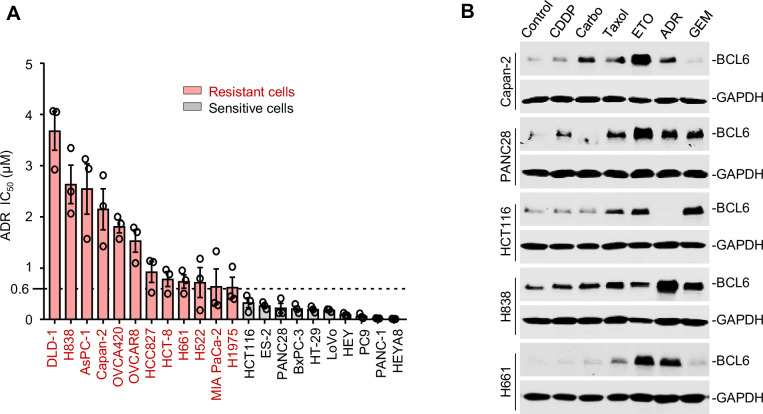
(A) Cell sensitivity to etoposide (ETO). Cancer cells were treated with etoposide at gradient concentrations for 48 hr. IC50s were measured using sulforhodamine B (SRB) assays. Values are expressed as mean ± SEM of three technical replicates, representative of three independent experiments with similar results. ETO-resistant cell lines are marked in red. Cell sensitivity to doxorubicin (ADR) was also examined (see Figure 1—figure supplement 1A). (B) Heat map illustrating expression of BCL6 target genes in Capan-2, H661, and PC9 cells. Cells were treated with etoposide at their respective 1/2 IC50s for 24 hr. mRNA was isolated from treated cells and sequenced. Z-scores were calculated based on counts of exon model per million mapped reads. BCL6 target genes were identified by a cutoff of p< 0.05, n=3. (C) BCL6 mRNA expression in ETO-resistant and -sensitive cells. Cells were treated with etoposide at their respective 1/2 IC50s for 24 hr. QPCR assays were subsequently performed. ETO-resistant cell lines are marked in red. (D) Validation of differentially expressed target genes of BCL6 in Capan-2 and H661 cells using qPCR analysis. Values are expressed as mean ± SEM of three technical replicates, representative of three independent experiments with similar results. *p<0.05, **p<0.01 and ***p<0.001, unpaired, two tailed t-test. (E) Normalized BCL6 mRNA expression in cells with acquired chemoresistance from published datasets. MCF7/ETO, required ETO-resistant MCF7; A2780/ADR, required ADR-resistant A2780. *p<0.05, ***p<0.001, unpaired, two tailed t-test. (F) BCL6 protein expression levels in different cancer cell lines in response to various genotoxic agents. Cells were treated with indicated genotoxic agents for 24 hr. BCL6 protein expression levels were detected and normalized to GAPDH expression using immunoblotting analysis. Representative images are shown in Figure 1—figure supplement 1B. The ratio of genotoxic agent-treated group to the control group was calculated. CDDP, cisplatin; Carbo, carboplatin; GEM, gemcitabine. (G) Kaplan-Meier curves of ovarian cancer patients treated with cisplatin, taxol or both drugs. The curves were stratified by BCL6 (215990_s_at) expression. The following source data, Supplementary file 1 and figure supplements are available for Figure 1.


