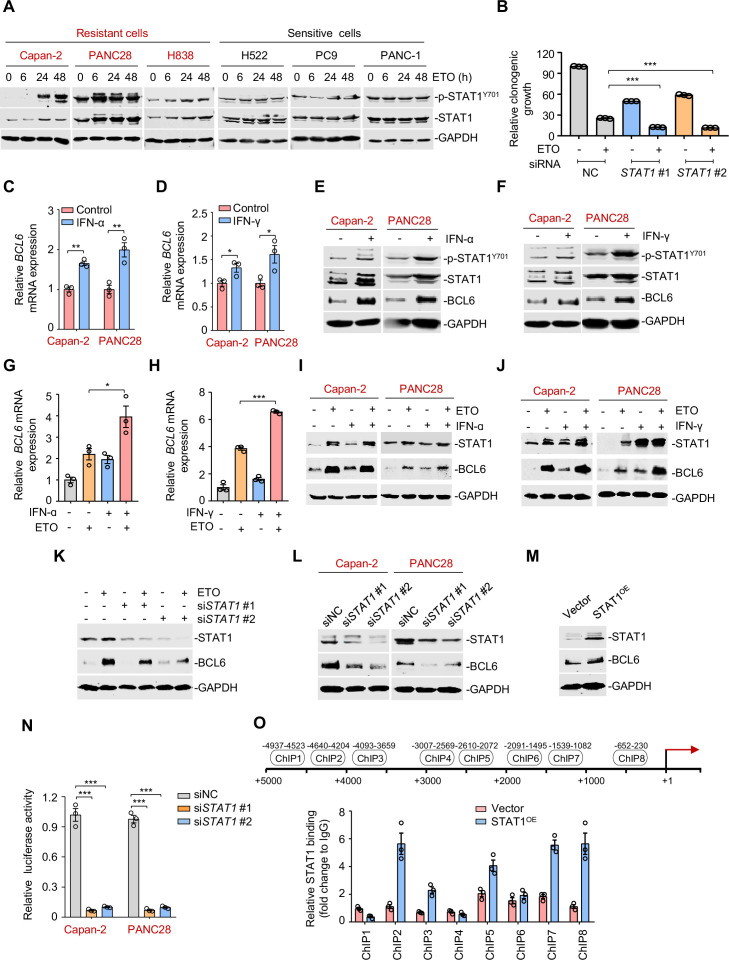
Figure 4. The interferon/STAT1 axis directly regulates B cell lymphoma 6 (BCL6) expression.
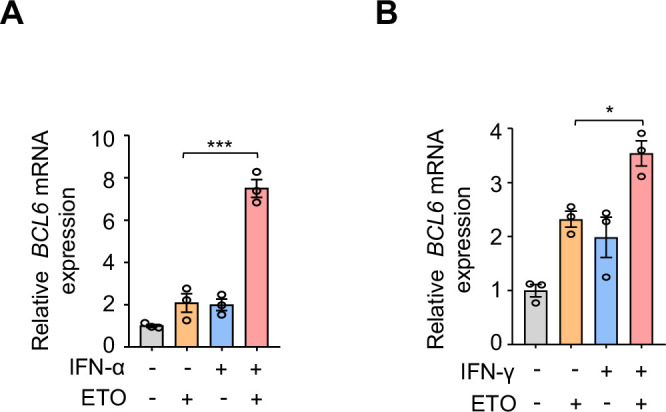
(A) STAT1 protein and its phosphorylation levels by immunoblotting analysis. ETO-resistant and -sensitive cells were treated with etoposide at their respective 1/2 IC50s for indicated time points. Cell lysates were collected and subjected to immunoblotting analysis. (B) Clonogenic growth of Capan-2 cells treated with siRNAs targeting STAT1, 0.2 μM etoposide, or their combinations. (C and D) Relative BCL6 mRNA expression. Capan-2 or PANC28 cells were treated with 50 ng/mL IFN-ɑ (C) or 10 ng/mL IFN-γ (D) for 24 hr. BCL6 mRNA levels were detected by qPCR assays. (E and F) IFN-ɑ and IFN-γ increased BCL6 and STAT1 protein levels. Capan-2 or PANC28 cells were treated with 50 ng/mL IFN-ɑ (E) or 10 ng/mL IFN-γ (F) for 24 hr. Cell lysates were subjected to immunoblot analysis with indicated antibodies. (G and H) Relative BCL6 mRNA expression. Capan-2 cells were treated with 50 ng/mL IFN-ɑ (G) or 10 ng/mL IFN-γ (H) in the presence or absence of 50 μM etoposide. BCL6 mRNA levels were detected. The same experiments were also repeated in PANC28 cells (see Figure 4—figure supplement 1A, B). (I and J) Immunoblotting analysis for BCL6 and STAT1 protein expression. Capan-2 or PANC28 cells were treated with 50 ng/mL IFN-ɑ (I) or 10 ng/mL IFN-γ (J) in the presence or absence of etoposide for 48 hr. Cell lysates were subjected to immunoblotting analysis with specific antibodies against BCL6, STAT1, and GAPDH. (K) STAT1 knockdown impaired etoposide-induced BCL6 activation. STAT1 silencing was performed by RNA interference in Capan-2 cells. Transfected cells were treated with 50 μM etoposide for 24 hr, and cell lysates were subjected to immunoblotting analysis. (L) Silencing of STAT1 decreased BCL6 expression in ETO-resistant Capan-2 and PANC28 cells. (M) Overexpression of STAT1 increased BCL6 expression. Capan-2 cells were transfected with pcDNA3.1-STAT1 or the control plasmid for 48 hr. Cell lysates were subjected to immunoblotting. (N) Relative luciferase activity. siRNAs targeting STAT1 and BCL6n-luc vector were transiently co-transfected into ETO-resistant Capan-2 and PANC28 cells. Luciferase activity was measured 48 hr post-transfection. (O) ChIP-qPCR data showing the enrichment of STAT1 binding to the BCL6 promoter region in Capan-2 cells. Capan-2 cells were transfected with pcDNA3.1-STAT1 or the control plasmid for 48 hr, and ChIP-qPCR analysis was then performed. Results are expressed as mean ± SEM of three technical replicates, representative of two or three independent experiments with similar results. * p<0.05, **p<0.01, ***p<0.01, unpaired, two tailed t-test. The following source data, Supplementary file 1 and figure supplements are available for Figure 4.
Figure 4—figure supplement 1. The interferon/STAT1 axis directly regulates B cell lymphoma 6 (BCL6) expression.


