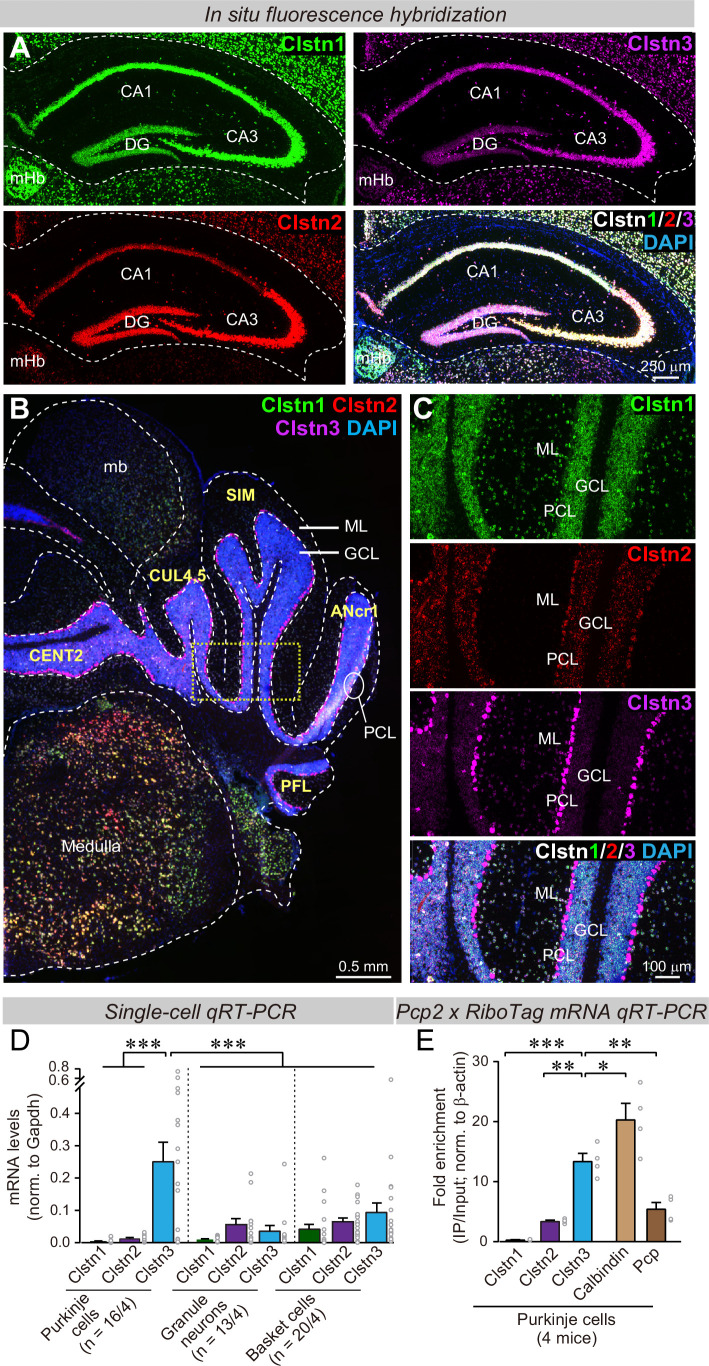
Figure 1. Clstn1, Clstn2, and Clstn3 are co-expressed in overlapping neuronal populations in the mouse hippocampus, but are largely expressed in separate neuronal populations in the mouse cerebellum.
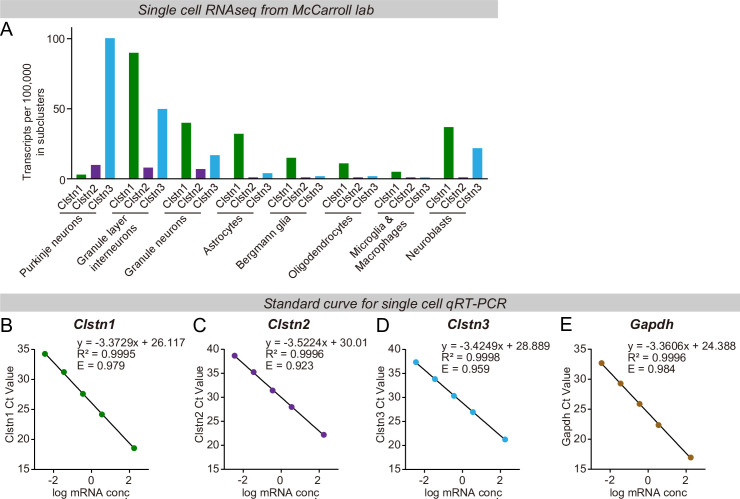
(A) Single-molecule in situ fluorescent hybridization (RNAscope) reveals that Clstn1, Clstn2 and Clstn3 exhibit largely overlapping expression patterns in the dorsal hippocampus. Representative images show sections from a mouse at P30 labeled with probes to Clstn1 (green), Clstn2 (red), and Clstn3 (magenta) and with DAPI (blue) as indicated (DG, dentate gyrus; CA1 and CA3, CA1- and CA3-regions of the hippocampus proper; mHb, medial habenula). (B & C) Different from the hippocampus, Clstn1 (green), Clstn2 (red), and Clstn3 (magenta) exhibit largely distinct, non-overlapping expression patterns in the cerebellum as visualized by single-molecule in situ hybridization (B, overview; C, expanded views of the area boxed in B; Mb, midbrain; ML, molecular layer; PCL, Purkinje cell layer; GCL, granule cell layer). Scale bars apply to all images in a set. (D) Single-cell qRT-PCR demonstrates that Purkinje cells uniquely express high levels of Clstn3 mRNAs. The cytosol of singe Purkinje, granule and basket cells in acute cerebellar slices from wild-type mice (n = 4 mice; number of cells are indicated in the graph) was aspirated via a glass pipette and subjected to qRT-PCR with primers validated in Figure 1—figure supplement 1B. mRNA levels were normalized to those of Gapdh using threshold cycle values (Ct). (E) Analyses of ribosome-associated mRNAs isolated from Purkinje cells confirms enrichment of Clstn3 expression in Purkinje cells. Ribosome-associated mRNAs were immunoprecipitated using HA-antibodies from the cerebellum of RiboTag mice that had been crossed with Pcp2-Cre mice. mRNA levels of Clstn1, Clstn2, Clstn3, Calbindin, and Pcp (Purkinje cell protein-2) were measured using qRT-PCR and normalized to the internal control of β-actin using threshold cycle values (Ct). Samples were from 4 mice. Data in D and E are means ± SEM. Statistical analyses were performed using one-way ANOVA and post-hoc Tukey tests for multiple comparisons. For D, F(8, 138) = 8.786, p < 0.000. ***denotes p < 0.001. For E, F(4,15)=33.065, p < 0.000. *denotes p < 0.05, **denotes p < 0.01, ***denotes p < 0.001.


