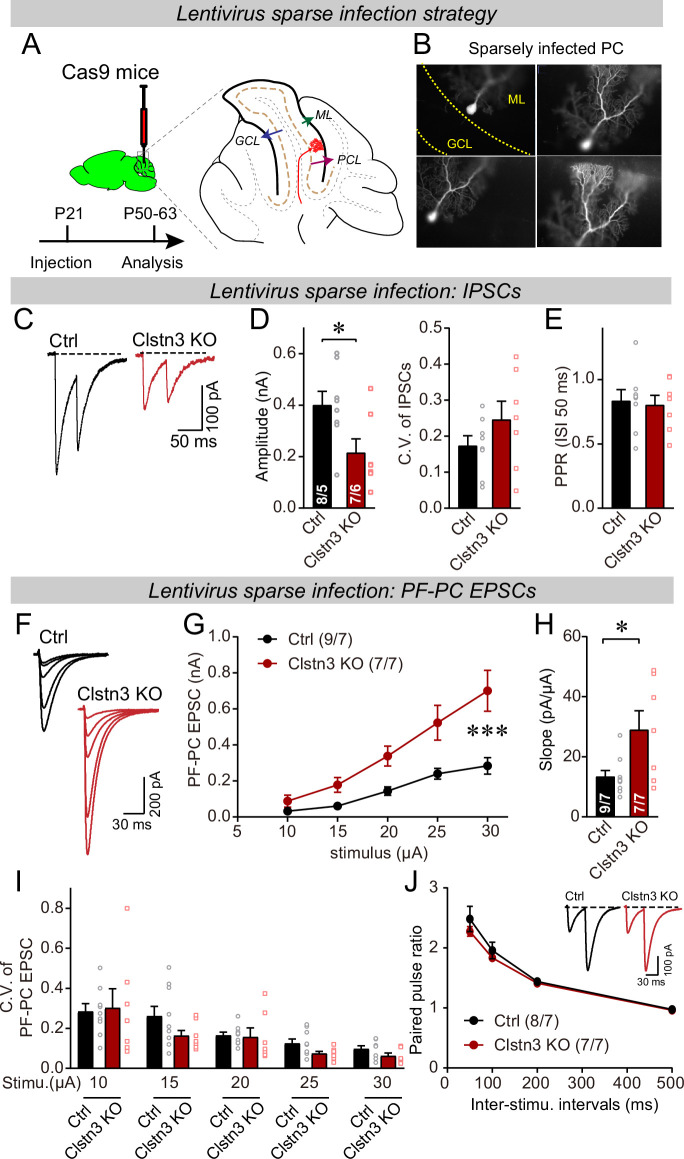
Figure 11. Sparse deletion of Clstn3 in Purkinje cells by low-titer lentiviral infection recapitulates the phenotype obtained with the AAV-mediated deletion of Clstn3 in the cerebellar cortex.
(A & B) Strategy and validation of the sparse Clstn3 deletion in Purkinje cells (A, experimental strategy; B, representative images of sparsely infected Purkinje cells, demonstrating that only isolated Purkinje cells and no granule or basket cells were infected). (C–E) The sparse Clstn3 KO in Purkinje cells decreases the amplitude of evoked IPSCs in the cerebellar cortex without changing the release probability (C, representative IPSC traces; D, IPSC amplitudes (left) and coefficient of variation (right); E, paired-pulse ratio of IPSCs with a 50ms inter-stimulus interval). (F–J) The sparse Clstn3 KO in Purkinje cells robustly increases the strength of parallel-fiber synapses, again without changing their release probability (F, representative traces; G, input/output curve of parallel-fiber EPSCs; H, summary graph of the slope of the input/output curve determined in individual cells; I coefficient of variation of evoked EPSCs at different stimulus intensities; J, plot of the paired-pulse ratio of parallel-fiber EPSCs). Data are means ± SEM. Two tailed unpaired t tests were applied to detect statistical significance with panels D, E and H. *p < 0.05. For panels G, I, and J, two-way ANOVA followed by post-hoc Tukey test was employed. For G, F(4, 68) = 31.695, **p < 0.000.


