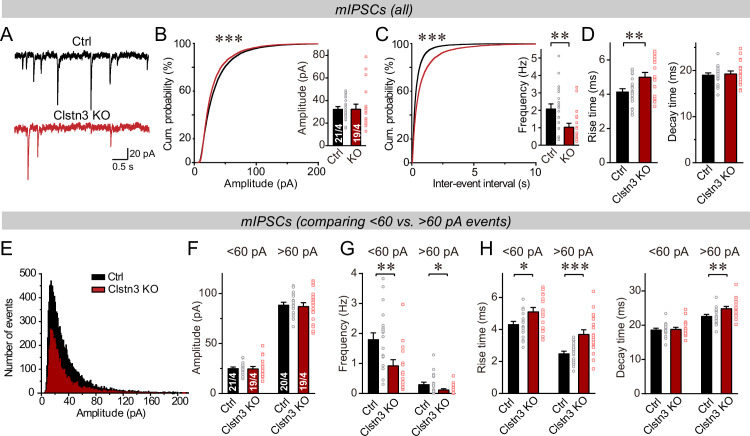
Figure 5. The Clstn3 KO decreases spontaneous inhibitory synaptic ‘mini’ events in Purkinje cells.
(A–C) The Clstn3 KO decreases the frequency but not the amplitude of mIPSCs (A, representative traces; B, left, cumulative probability plot of the mIPSC amplitude right, average amplitude; C, left, cumulative probability plot of the mIPSC inter-event interval right, average frequency). (D) The Clstn3 KO increases the rise but not decay times of mIPSCs. (E) Plot of the number of mIPSC events vs. amplitude exhibiting a normal distribution. (F–H) The Clstn3 KO similarly impairs mIPSCs with a larger ( > 60 pA) and a smaller amplitude ( < 60 pA), which in Purkinje cells are likely generated primarily by basket cell and stellate cell synapses, respectively (F & G, summary graphs for the mIPSC amplitude [F] and frequency [G] separately analyzed for high- and low-amplitude events; H, mIPSC rise [left] and decay times [right], separately analyzed for high- and low-amplitude events). All summary data are means ± SEM. Numbers of cells/mice analyzed are indicated in bar graphs. Statistical analyses were performed using unpaired t-tests (bar graphs with two groups) or Kolmogorov-Smirnov test (cumulative analysis), with *p < 0.05, **p < 0.01, ***p < 0.001.
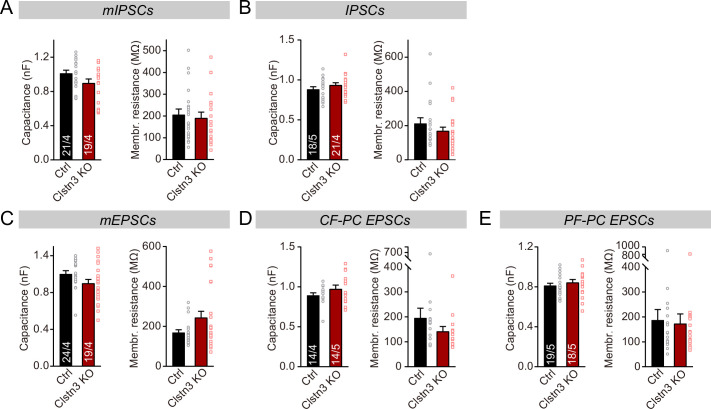
Figure 5—figure supplement 1. The capacitance and membrane resistance of Purkinje cells are unaffected by the Clstn3 KO.
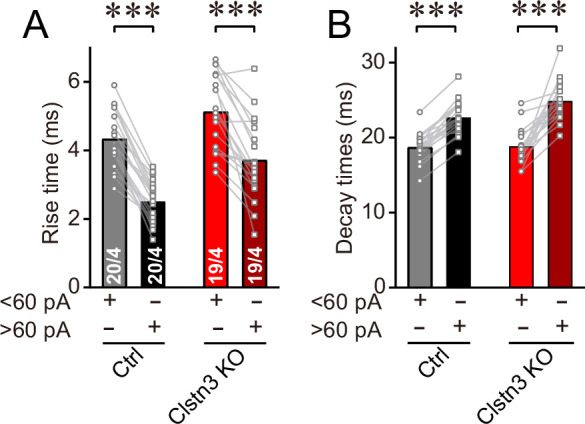
Figure 5—figure supplement 2. Analysis of the kinetics of large ( > 60 pA) and smaller ( < 60 pA) mIPSCs confirm that larger mIPSCs, which are presumably generated by basket-cell synapses closer to the soma, have faster rise but slower decay times.


